DISEASES IMPACTS PREDICTED FROM POLLUTION IN SWALE: 2017-2027
This table predicts increases in diseases coming from PM2.5 (excluding NOx).
Swale Borough Council AQMAs only measure NOx, so they miss the increases in harm to local residents from other products of friction and combustion. SBC measurements in Greenstreet have been badly undermined by their placement of NOx dispersion tubes above head height. This year they have corrected the height but I have noticed times when only 50% of the tubes are present. So SBC does not accurately reflect the real world for residents.
| Differences between Baseline (2017) and Ten Year Scenario (2027) - diseases by year per 100,000 & deaths by year per 100,000 - Swale Borough Figures | |||||||||||
Year |
2017 | '18 | '19 | '20 | '21 | '22 | '23 | '24 | '25 | '26 | 2027 |
| coronary heart disease |
0 | 50 | 114 | 158 | 214 | 261 | 299 | 360 | 390 | 441 | 488 |
| copd | 0 | 40 | 83 | 115 | 138 | 174 | 199 | 212 | 239 |
254 | 268 |
| stroke | 0 | 11 | 31 | 43 | 54 | 67 | 80 | 94 | 107 | 110 | 126 |
| asthma | 0 | 0 | 2 | 4 | 8 | -94 | -91 | -85 | 32 | 34 | -64 |
| diabetes | 0 | 61 | 104 | 159 | 207 | 256 | 296 | 350 | 395 | 437 | 493 |
| lung cancer | 0 | 8 | 9 | 10 | 10 | 11 | 11 | 12 | 11 | 12 | 12 |
| deaths | 0 | 0 | 10 | 33 | 68 | 104 | 143 | 197 | 254 | 261 | 405 |
(Source: Public Health England Modelling software, 2018) - "Air pollution: a tool to estimate healthcare costs 2018" - you can scroll to the bottom of that page to download and run the tool yourself if you like.
Notes
- This table shows PM2.5 pollution excluding Nitrogen Dioxide.
Nitrogen Dioxide levels will now remain fairly stable in Swale over the next ten years.
Curiously, NOx will lead to increased admissions with diabetes over the whole period! - The numbers are for the whole Swale Borough. However, logic tells us that most harm will hit places with the worst pollution - along busy roads with the greatest concentration of pollution (the AQMA areas).
- The figures may include a worsening of symptoms for those with existing illness.
- Heavier vehicles create more friction-based particles - electric vehicles are currently heavier than the 'standard' vehicles. This explains why some sources point to heavier PM2.5 as electric vehicles increase their numbers.
Traffic Flow: Understanding how and why queues grow. Visit our Traffic Flow Page to learn more about traffic burdens on the A2 and the changes in types of vehicles between 2000-2017.
What is included in "PM2.5"?
DEFRA's Air Quality Expert Group, 2012 - read PDF.
Significantly, in 2012, this report asked for at least five years worth of data to improve understanding PM2.5 pollution products and sources. Today (2018), a clearer picture has formed and the severity of the danger has been accepted by WHO, EU and UK Government.
- nitrate (NOx), sulphate and organics are major components.
- sulphur dioxide - frequently from combustion,
- polycyclic aromatic hydrocarbons - more than 100 chemicals found in smoking cigarettes, breathing secondhand smoke, vehicle exhaust, fumes from asphalt, emissions from fossil fuels, fires ....... and volcanoes!
- benzene - from vehicle fuels, rubber compounds.
- 1,3- butadiene - a known carcinogen associated with rubber compounds
- iron-rich dusts are attributed to non-exhaust traffic emissions - friction products.
- calcium salts are attributed to construction/demolition dust and wind-blown soil.
- sodium chloride to sea salt (and resuspended de-icing salt).
- Elemental carbon relates to primary combustion.
- Organic carbon (organics, soot), both from combustion and natural sources.
- carbon monoxide
- lead - persistent pollutant in our environment; suspended lead is more likely from polluted land since leaded petrol is a thing of the past; lead accumulates in the body.
DEFRA's Dedicated Page to understanding PM2.5 - visit the DEFRA web page
The DEFRA page is very much worth visiting as it summarises the current understanding. Not least is their acceptance of the World Health Organisations (WHO) conclusion:
"there is understood to be no safe threshold below which no adverse effects would be anticipated".
The bulk of historic research into "particulate matter as pollution" has not differentiated between PM10 and the smaller PM2.5 particles. Today we KNOW the finer particles and compounds penetrated deeply into all our organs. The harms are constantly being updated and better understood. All we need now is for SBC to get ahead of the curve when considering the investments in infrastructure and development planning ...
Why are PM2.5 products dangerous?
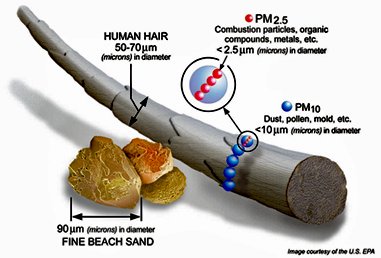
Particles of this size:-
- penetrate more deeply into our lungs and across our membranes to find their way into our blood and organs;
- remain suspended in the air longer to become concentrated at ground level and spreading further, so we breath them in for longer;
- can be lifted from surfaces by the lightest winds to return to the air we breath;
- can blow over great distances. e.g. industry (including quarrying and excavation, shipping, aircraft, continental sources (fires, vehicles, volcanoes), etc.
The most vulnerable to pollution are the very young and the older members of our communities. But all of us are harmed by all pollution levels - making existing conditions worse, challenging our immune systems, potentially leading to more serious illness.
Household Pollution - DEFRA & WHO
DEFRA - Air Quality Expert Group (AQEG) Report: Biomass Combustion Report - 2017 (80 pages, technical and addresses commercial biomass burners and domestic)
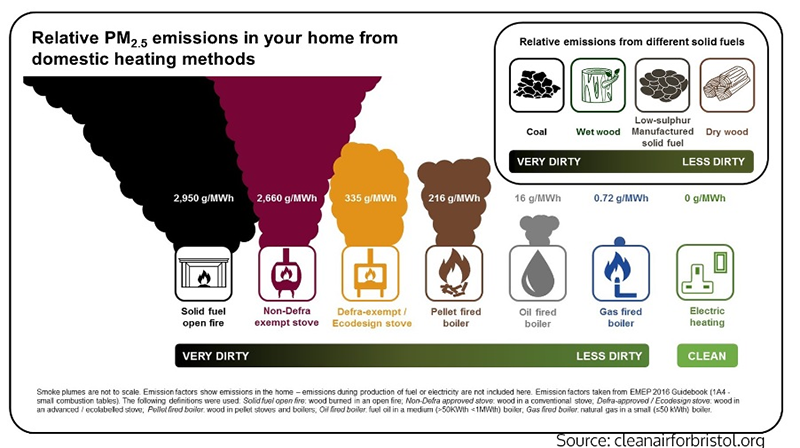
Inefficient (non-Defra exempt) woodburning stoves send very large quantities of soot (PM2.5) into the home and outdoors
Non-seasoned (wet/sappy) wood creates inefficient burning at all times (check your supplier or if you cut your own logs, leave it stacked at least a year).
If you live in an emission-controlled area, 2020 is the year for you to focus on!
Find an 'Ecodesign' (Defra-exempt) Woodburning Stove - Visit the site of HETA, a not-for-profit organisation working for Defra. Check the box "Defra exempt". The restrictions come to bear in Smoke Control Areas.
Defra List: Exempt Appliances in England - Defra's own list - for legal certainty.
World Health Organisation (WHO) Guidelines for indoor air quality: selected pollutants (2010). WHO Document (PDF). It is astonishing just how many products add to the air pollution burden inside our homes. 484 pages
Reading List
- Research and analysis: Air quality: Assessing progress towards WHO guideline levels of PM2.5 in the UK.
- Guidance: Medium combustion plant (MCP): comply with emission limit values.
Government Policy Statements on PM2.5:-
Guardian article - "2017 - Early 40 million people live in UK areas with illegal air pollution"
Guardian article - "2017 - Diesel cars emit 10 times more toxic pollution than trucks and buses, data shows"
USA Government website on air pollution measurement.
State of Global Health website: "Health Effects of Air Pollution - Among the air pollutants, fine particulate matter (PM2.5) is the most consistent and robust predictor of mortality in studies of long-term exposure." PDF copy
Visualisation
Size
Combustion Particles at Home (CleanAirforBristol.org graphic)