TYPES OF POLLUTANTS EXPLAINED
A SIMPLE TRUTH: Higher pollution leads to more harm, more quickly. Pollution in and around AQMA5 (Greenstreet), is daily above what the World Health Organisation (WHO) tells us is safe - we are on track for "moderate" pollution for this year and onwards.
Higher pollution visits us frequently:-
- Pollution levels have several times breached "high" levels of pollution for periods in excess of 24-hours.
- More worrying - we have also seen many episodes at "very high" levels for an hour or more.
All these measurements show that we are being harmed, as defined by the World Health Organisation (WHO).
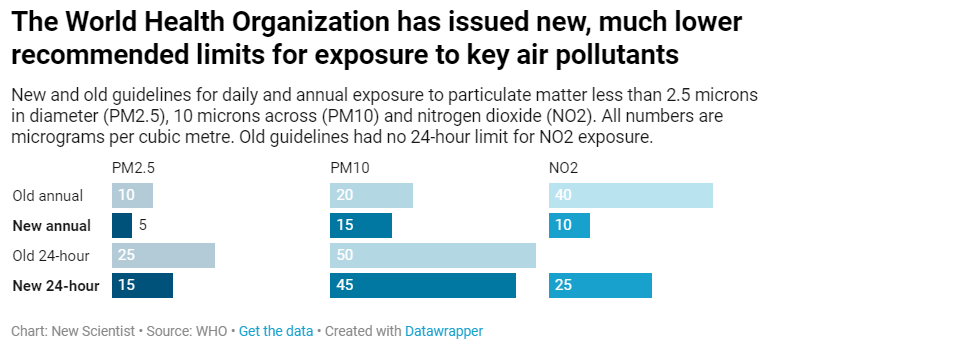
Fifteen years on from the last "Air Polution Report", the World Health Organisation has redefined the "harmful levels" of key pollutants - Read the Report. Infographic from the New Scientist summarises the changed picture very weill:
Because SBC only measures NOx (inaccurately) they are describing a world that we don't live in!
If you want a very straightforward illustration of why PM2.5 is the strongest indicator of likely death and harm - check this PDF document created by State of Global Air website (Canadian).
National Government Perspective - The Office of National Statistics (ONS) records annual levels of pollution from emissions.
Their tables don't include friction-based pollution (which accounts for about 50% of total pollution associated with traffic).
Their measurements give a useful
background picture but they cannot tell us about local variability.
In the ONS table, I have highlighted the NOx line that SBC focuses on.
The local perspective around AQMA5 (Greenstreet) is unfolding through the "Pollution Diary".
What do we mean by "pollutant" and how does it affect us? |
| Source: World Health Organisation Fact Sheet (2nd May 2018). |
|
Particulate matter (PM)
11th July 2019: Air Quality Expert Group (AQEG) - Non-Exhaust Emissions (NEE) from Road Traffic - BBC or read the Executive Summary or Full 93-page AQEG Report. In short, this confirms the greater danger facing us today is from brake and road wear as vehicles of all sizes accellerate and brake in built-up areas like the AQMAs to create damaging PM2.5 and PM10. NEW |
Definition and principal sources
PM is a common proxy indicator for air pollution. It affects more people than any other pollutant. The major components of PM are sulfate, nitrates, ammonia, sodium chloride, black carbon, mineral dust and water. It consists of a complex mixture of solid and liquid particles of organic and inorganic substances suspended in the air. While particles with a diameter of 10 microns or less, (≤ PM10) can penetrate and lodge deep inside the lungs, the even more health-damaging particles are those with a diameter of 2.5 microns or less, (≤ PM2.5). PM2.5 can penetrate the lung barrier and enter the blood system. Chronic exposure to particles contributes to the risk of developing cardiovascular and respiratory diseases, as well as of lung cancer.
Air quality measurements are typically reported in terms of daily or annual mean concentrations of PM10 particles per cubic meter of air volume (m3). Routine air quality measurements typically describe such PM concentrations in terms of micrograms per cubic meter (μg/m3). When sufficiently sensitive measurement tools are available, concentrations of fine particles (PM2.5 or smaller), are also reported.
Health effects
There is a close, quantitative relationship between exposure to high concentrations of small particulates (PM10 and PM2.5) and increased mortality or morbidity, both daily and over time. Conversely, when concentrations of small and fine particulates are reduced, related mortality will also go down – presuming other factors remain the same. This allows policy makers to project the population health improvements that could be expected if particulate air pollution is reduced.
Small particulate pollution have health impacts even at very low concentrations – indeed no threshold has been identified below which no damage to health is observed. Therefore, the WHO 2005 guideline limits aimed to achieve the lowest concentrations of PM possible.
WHO Air Quality Guideline values - See above infographic issued 22nd September 2021
In addition to guideline values, the Air Quality Guidelines provide interim targets for concentrations of PM10 and PM2.5 aimed at promoting a gradual shift from high to lower concentrations.
If these interim targets were to be achieved, significant reductions in risks for acute and chronic health effects from air pollution can be expected. Achieving the guideline values, however, should be the ultimate objective.
The effects of PM on health occur at levels of exposure currently being experienced by many people both in urban and rural areas and in developed and developing countries – although exposures in many fast-developing cities today are often far higher than in developed cities of comparable size.
Nitrogen dioxide (NO2)
Source: World Health Organisation Fact Sheet (2nd May 2018).
Guideline values -
NO2
40 μg/m3 annual mean
200 μg/m3 1-hour mean
The current WHO guideline value of 40 µg/m3 (annual mean) was set to protect the public from the health effects of gaseous.
Definition and principal sources
As an air pollutant, NO2 has several correlated activities. At short-term, concentrations exceeding 200 μg/m3, it is a toxic gas which causes significant inflammation of the airways.
NO2 is the main source of nitrate aerosols, which form an important fraction of PM2.5 and, in the presence of ultraviolet light, of ozone. The major sources of anthropogenic emissions of NO2 are combustion processes (heating, power generation, and engines in vehicles and ships).
Health effects
Epidemiological studies have shown that symptoms of bronchitis in asthmatic children increase in association with long-term exposure to NO2. Reduced lung function growth is also linked to NO2 at concentrations currently measured (or observed) in cities of Europe and North America.
Volatile Organic Compounds (VOCs)
Main Source: Plume Laboratories (plus other sources referenced)
What is it? These are molecules made mainly of carbon and found as gases in the air we breathe. They are very volatile and can spread a long way away from their emission source. See Pollution Diary for 15th & 16th March 2019 for examples of exceedance with wind from the West - I have no explanation - perhaps there was a large fire to the West over both those days? Background pollution levels do not explain these two days.
Where do they come from? VOCs are emitted by traffic, industries and the residential sector, and also by vegetation. Indoors, cleaning and DIY products are important emitters of VOCs, as well as some floor and wall coatings. VOCs are released from burning fuel such as petrol, wood, coal, or natural gas. Can combine with NOx to create 'smog'/haze.
What are the risks? In cases of high concentration, they can cause irritation and decreased breathing capacity. Some VOCs are classified as carcinogenic.