
POLLUTION DIARY
HISTORIC DATA - YEAR 2
-- 1st MARCH 2020 to END FEBRUARY 2021 --
(after this period, I used a new device Flow 2)
Return to Current Year
Explore Pre-Covid-19 Period (2020-2021)
- The Pollutants: I record four out of the five most toxic air pollutants associated with vehicles. I don't measure Ammonia (NH3).
- The Flow device: this measured as 90-95% accurate when compared with professional static monitors. Most of my data comes from one point close to the new Blind Company on Greenstreet/A2. The advantage of the Flow device is that it can measure "on the move". This allows me to create maps in real time in different stretches of road/lane around Greenstreet and show how pollution spreads a long way into our communities.
- Air Quality Indicators: These are based on EU, USA, and WHO thresholds for harmful pollutants over 1 hour, 24 hours, and a year.
- There are no known "safe levels" of PM2.5. This very fine form of pollution has many impacts, depending on the mix and size of particles (soot, soot binding to toxins, minerals, metals, organic compounds, and ozone)
- You will notice that pollution episodes can spread overnight.
AIR QUALITY INDICATOR (AQI) USED ON THIS SITE
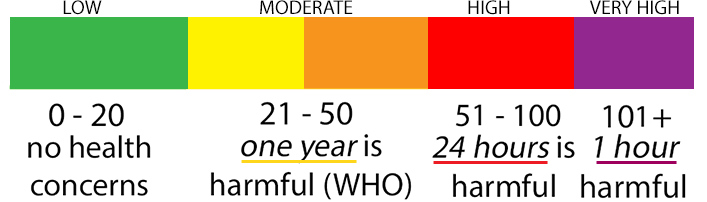
(Bear in mind, there are no known lower safety levels for PM2.5)
Comments: Over recent weeks, the daily averages have often read "LOW" but that hides some serious pollution that is dangerous to health over shorter periods/peaks. This makes the case for continuous monitoring rather than the inadequate policy of Swale Borough Council who rely on ANNUAL averages of only Nitrogen Dioxide in Greenstreet. That is why they can suggest rescinding the AQMA5 status. Although they are also trying to persuade us that pollution is SO BAD that we need a bypass! Make up your minds SBC!
NOTE: The static measurements that I have been making are taken along the A2 but West of the AQMA5.
Bear in mind that the measurements made by SBC barely even after correcting the siting of their 'diffusion tubes' - pressed by Lynsted with Kingsdown Parish Council's criticism. Even so, SBC uses the lowest accuracy configuration of those tubes (singly).
SBC also fails to test for the more harmful PM2.5, PM10, and VOCs.
It appeaers that SBC would rather NOT know how much physical harm their decisions on planning have on our DAILY lives!
| Toxic Pollution Levels | Exceedances (time and duration) | |||||||
| Date | PM2.5 | PM10 | NO2 | VOCs | Daily Average |
High (24 hours or more) |
Very High + (1 hour or more) |
Graphs, Maps and Comments |
| MARCH 2020 | ||||||||
| 1st March | 14 | 30 | 5 | 12 | MODERATE | 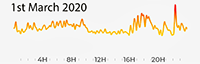 Light Rain Showers (0.20mm). Wind 35-30-18km/h (gusts 57-36-32km/h) - SW-WSW-SW. PM2.5 Peak 9pm-11pm Light Rain Showers (0.20mm). Wind 35-30-18km/h (gusts 57-36-32km/h) - SW-WSW-SW. PM2.5 Peak 9pm-11pm |
||
| 2nd March | 15 | 30 | 5 | 9 | MODERATE | 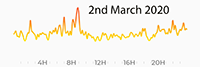 Patchy Rain (1.90mm). Wind 17-24-20km/h (gusts 28-35km/h) - S-NNW-W. Patchy Rain (1.90mm). Wind 17-24-20km/h (gusts 28-35km/h) - S-NNW-W. |
||
| 3rd March | 14 | 32 | 12 | 10 | MODERATE | 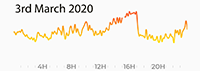 Light Drizzle (0.70mm). Wind 19-22-14km/h (gusts 35-30-26km/h) - WSW-W. NOx peaks midday to 5pm! Run around Teynham Moderate and High patches. Light Drizzle (0.70mm). Wind 19-22-14km/h (gusts 35-30-26km/h) - WSW-W. NOx peaks midday to 5pm! Run around Teynham Moderate and High patches. |
||
| 4th March | 20 | 29 | 22 | 10 | MODERATE | 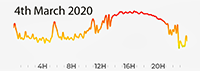 Light Rain Shower (3.50mm). Wind 15-8-17km/h (gusts 28-13-27km/h) - W-SSW-ESE. PM2.5 Peaks at 6am, midday and 4-6pm! Light Rain Shower (3.50mm). Wind 15-8-17km/h (gusts 28-13-27km/h) - W-SSW-ESE. PM2.5 Peaks at 6am, midday and 4-6pm! |
||
| 5th March | 18 | 29 | 2 | 11 | MODERATE | 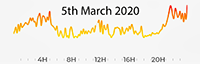 Heavy Rain (26.70mm). Wind 7-39km/h (gusts 11-55km/h) - E-NE-N. Heavy Rain (26.70mm). Wind 7-39km/h (gusts 11-55km/h) - E-NE-N. |
||
| 6th March | 19 | 29 | 14 | 14 | MODERATE | 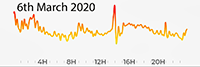 Partly Cloudy (1.60mm). Wind 30-18-6km/h (gusts 42-22-12km/h) - NNW-NW-WNW. Partly Cloudy (1.60mm). Wind 30-18-6km/h (gusts 42-22-12km/h) - NNW-NW-WNW. |
||
| 7th March | 5 | 25 | 4 | 10 | MODERATE | Near exceedance | 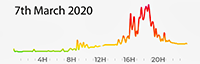 Patchy Rain Possible (0.10mm). Wind 10-27km/h (gusts 18-49km/h) - WSW-SW.. VOCs increased during the day but PM10 massively peaked to near exceedance from 17.40-18.40pm. Patchy Rain Possible (0.10mm). Wind 10-27km/h (gusts 18-49km/h) - WSW-SW.. VOCs increased during the day but PM10 massively peaked to near exceedance from 17.40-18.40pm. |
|
| 8th March | 4 | 14 | 6 | 25 | MODERATE | 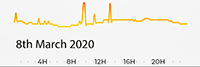 Light Rain Shower (2.90mm). Wind 35-30-20km/h (gusts 58-44-35km/h) - SSW-SW-WSW. Unusually dominated by VOCs without peaks; Peaks are PM10. Light Rain Shower (2.90mm). Wind 35-30-20km/h (gusts 58-44-35km/h) - SSW-SW-WSW. Unusually dominated by VOCs without peaks; Peaks are PM10. |
||
| 9th March | 4 | 15 | 2 | 20 | MODERATE | 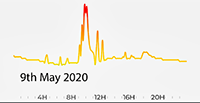 Patchy Rain Possible (2.40mm). Wind 22-26-38km/h (gusts 37-36-62km/h) - WSW-W-SSW. Unusually dominated by VOCs without peaks; Peaks are PM10. Patchy Rain Possible (2.40mm). Wind 22-26-38km/h (gusts 37-36-62km/h) - WSW-W-SSW. Unusually dominated by VOCs without peaks; Peaks are PM10. |
||
| 10th March | 5 | 13 | 6 | 21 | MODERATE | 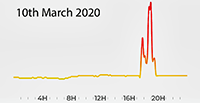 Light Drizzle (8.40mm). Wind 37-27-36km/h (gusts 62-46-64km/h) - SW-WSW. Unusually dominated by VOCs without peaks; The peak was PM10 (VERY HIGH 18.45-19.00). Running along Lower Road 54 vehicles passed - before roadworks the figure was 5 or 6 vehicles in the same off-peak periods. Light Drizzle (8.40mm). Wind 37-27-36km/h (gusts 62-46-64km/h) - SW-WSW. Unusually dominated by VOCs without peaks; The peak was PM10 (VERY HIGH 18.45-19.00). Running along Lower Road 54 vehicles passed - before roadworks the figure was 5 or 6 vehicles in the same off-peak periods. |
||
| 11th March | 4 | 10 | 4 | 18 | LOW |
 Light Rain Showers (3.50mm). Wind 38-30-36km/h (gusts 62-42-56km/h) - SW-WSW. Light Rain Showers (3.50mm). Wind 38-30-36km/h (gusts 62-42-56km/h) - SW-WSW. |
||
| 12th March | 5 | 17 | 1 | 14 | LOW |
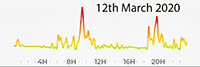 Patchy Rain Possible (2.00mm). Wind 34km/h (gusts 61-57km/h) - WSW. Running along Lower Road 63 vehicles passed - before roadworks the figure was 5 or 6 vehicles in the same off-peak periods. Patchy Rain Possible (2.00mm). Wind 34km/h (gusts 61-57km/h) - WSW. Running along Lower Road 63 vehicles passed - before roadworks the figure was 5 or 6 vehicles in the same off-peak periods. |
||
| 13th March | 5 | 24 | 8 | 11 | MODERATE | 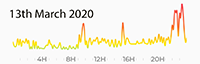 Light Rain Shower (0.60mm). Wind 39-13km/h (62-25km/h) - WSW - SW. Light Rain Shower (0.60mm). Wind 39-13km/h (62-25km/h) - WSW - SW. |
||
| 14th March | 16 | 27 | 0 | 15 | MODERATE | 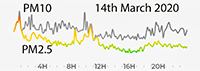 Light Rain Shower (6.80mm). Wind 9-23km/h (gusts 16-39km/h) - SSW-SW..Graph shows how PM2.5 often shadows PM10 throughout the day. Light Rain Shower (6.80mm). Wind 9-23km/h (gusts 16-39km/h) - SSW-SW..Graph shows how PM2.5 often shadows PM10 throughout the day. |
||
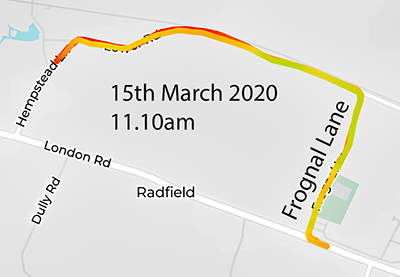
| 15th March | 13 | 26 | 1 | 15 | MODERATE | 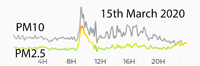 Light Rain Shower (1.40mm). Wind 24-33-3km/h (gusts 42-48-4km/h) - SW-SSW-ENE. Jogging Map. Light Rain Shower (1.40mm). Wind 24-33-3km/h (gusts 42-48-4km/h) - SW-SSW-ENE. Jogging Map. |
||
| 16th March | 17 | 26 | 3 | 10 | MODERATE | 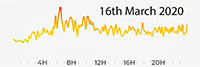 Partly Cloudy (1.20mm). Wind 4-11km/h (gusts 6-21km/h) - NW-WSW. Partly Cloudy (1.20mm). Wind 4-11km/h (gusts 6-21km/h) - NW-WSW. |
||
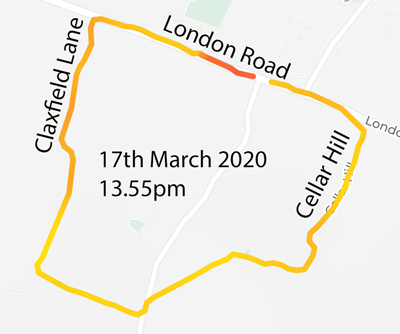
| 17th March | 19 | 30 | 1 | 15 | MODERATE | 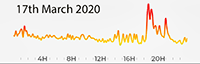 Overcast (dry). Wind 11-22km/h (gusts 22-39km/h) - WSW-SW. Jogging Map Overcast (dry). Wind 11-22km/h (gusts 22-39km/h) - WSW-SW. Jogging Map |
||
| 18th March | 16 | 24 | 2 | 16 | MODERATE |  Overcast (dry). Wind 23-13km/h (gusts 42-25km/h) - SW. Overcast (dry). Wind 23-13km/h (gusts 42-25km/h) - SW. |
||
| 19th March | 17 | 19 | 2 | 9 | LOW |
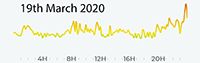 Low pollution is encouraging for walkers and runners getting in their daily exercise. Low pollution is encouraging for walkers and runners getting in their daily exercise. |
||
| 20th March | 18 | 39 | 1 | 8 | MODERATE | 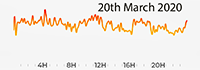 |
||
| 21st March | 17 | 32 | 4 | 6 | MODERATE | 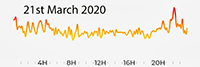 |
||
| 22nd March | 18 | 28 | 20 | 7 | MODERATE | 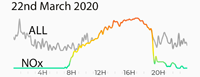 Sunday. NOx has started to feature as a 'bulge' that shifts day-to-day - I am assuming that this reflects the periods when all the lorries trying to get through the traffic lights. But PM10 still dominates throughout the day.. Sunday. NOx has started to feature as a 'bulge' that shifts day-to-day - I am assuming that this reflects the periods when all the lorries trying to get through the traffic lights. But PM10 still dominates throughout the day.. |
||
| 23rd March | 26 | 31 | 26 | 8 | MODERATE | 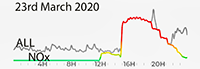 NOx afternoon bulge when traffic is slow to get through the traffic lights. NOx afternoon bulge when traffic is slow to get through the traffic lights. |
||
| 24th March | 25 | 24 | 24 | 12 | MODERATE | 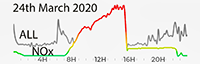 NOx bulge throughout the daylight hours. NOx bulge throughout the daylight hours. |
||
| 25th March | 27 | 24 | 17 | 10 | MODERATE | 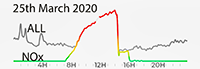 NOx bulge 8am-2pm. PM2.5 dominated though! NOx bulge 8am-2pm. PM2.5 dominated though! |
||
| 26th March | 38 | 32 | 18 | 11 | MODERATE | 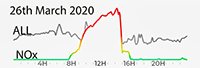 Bad day. NOx bulge all day in 'normal' working hours. Bad day. NOx bulge all day in 'normal' working hours. |
||
| 27th March | 38 | 38 | 18 | 15 | MODERATE | 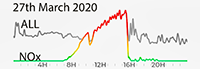 Bad day. NOx bulge during working hours. Bad day. NOx bulge during working hours. |
||
| 28th March | 25 | 41 | 3 | 13 | MODERATE | 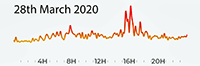 Saturday and no NOx bulge! PM2.5 has been higher for a week now. Saturday and no NOx bulge! PM2.5 has been higher for a week now. |
||
| 29th March | 18 | 42 | 13 | 8 | MODERATE | 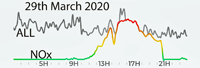 Sunday NOx bulge from midday to 9pm. Curious. Sunday NOx bulge from midday to 9pm. Curious. |
||
| 30th March | 15 | 31 | 9 | 11 | MODERATE | 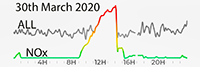 Midday peak for NOx returns! Midday peak for NOx returns! |
||
| 31st March | 15 | 31 | 10 | 13 | MODERATE | 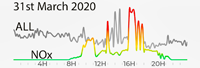 With multiple peaks spread across the day may suggest a change in traffic as Docwra take down their barriers ready to move them down towards the West end of Greenstreet. With multiple peaks spread across the day may suggest a change in traffic as Docwra take down their barriers ready to move them down towards the West end of Greenstreet. |
||
| APRIL 2020 | ||||||||
| 1st April | 18 | 24 | 16 | 13 | MODERATE | 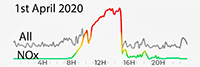 NOx 'bulge' continues to feature. NOx 'bulge' continues to feature. |
||
| 2nd April | 14 | 23 | 0 | 21 | MODERATE | 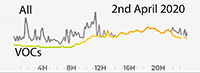 VOC 'bulge'. VOC 'bulge'. |
||
| 3rd April | 21 | 42 | 2 | 19 | MODERATE | 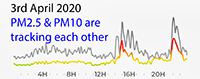 Notice how PM2.5 and PM10 mirror each other. Notice how PM2.5 and PM10 mirror each other. |
||
| 4th April | 23 | 28 | 2 | 18 | MODERATE | 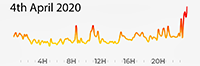 PM2.5 and PM10 ran 'neck and neck' but there were no sustained bulges or peaks. A confirmation that people stayed at home on this sunny Saturday. PM2.5 and PM10 ran 'neck and neck' but there were no sustained bulges or peaks. A confirmation that people stayed at home on this sunny Saturday. |
||
| 5th April | 17 | 22 | 4 | 19 | MODERATE | 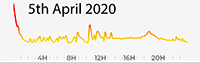 Minor peaks at usual travel times. Minor peaks at usual travel times. |
||
| 6th April | 12 | 23 | 2 | 22 | MODERATE | 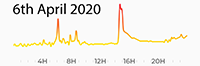 Curious peaks. We did seem to have more blockages than usual with the lower levels of traffic? Curious peaks. We did seem to have more blockages than usual with the lower levels of traffic? |
||
| 7th April | 20 | 37 | 4 | 13 | MODERATE | 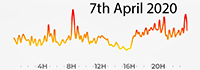 The workmen repairing the water main were outside our home on 7th and 8th. So the higher figures may have been influenced. Although that doesn't account for 'out of hours' peaks. So, not the whole story! The workmen repairing the water main were outside our home on 7th and 8th. So the higher figures may have been influenced. Although that doesn't account for 'out of hours' peaks. So, not the whole story! |
||
| 8th April | 42 | 41 | 1 | 13 | MODERATE | 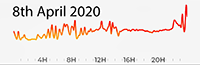 As above. As above. |
||
| 9th April | 50 | 52 | 2 | 13 | HIGH | EXCEEDANCE | EXCEEDANCE 07.33 - 08.47 .  |
 THIS LOOKS TERRIBLE! BUT ... the VERY HIGH peak occurred when the workmen were using machinery within two metres of the monitor - so, all I can say is that only we were experiencing harm! The afternoon quietened down after the workmen finished and closed their operations down for Easter. THIS LOOKS TERRIBLE! BUT ... the VERY HIGH peak occurred when the workmen were using machinery within two metres of the monitor - so, all I can say is that only we were experiencing harm! The afternoon quietened down after the workmen finished and closed their operations down for Easter. |
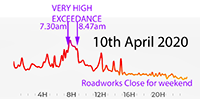
| 10th April | 33 | 36 | 1 | 12 | MODERATE | 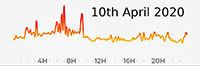 Still not good, but better than when workmen and their generators are not next to you! High pressure systems also may be trapping particles near ground level to add to our woes. Similar overall shape of the graph = quieter afternoon. Still not good, but better than when workmen and their generators are not next to you! High pressure systems also may be trapping particles near ground level to add to our woes. Similar overall shape of the graph = quieter afternoon. |
||
| 11th April | 18 | 24 | 1 | 14 | MODERATE | 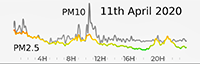 Apart from the late-morning peak, the pollution has been pretty tame again. The A2 has been quieter. PM2.5 was a bit worrying (coloured line). Apart from the late-morning peak, the pollution has been pretty tame again. The A2 has been quieter. PM2.5 was a bit worrying (coloured line). |
||
| 12th April | 17 | 21 | 2 | 17 | MODERATE | 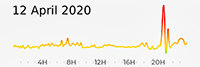 There was a modest increase in traffic at around 9pm that pushed this graph into MODERATE rather than LOW. There was a modest increase in traffic at around 9pm that pushed this graph into MODERATE rather than LOW. |
||
| 13th April | 17 | 40 | 6 | 6 | MODERATE | 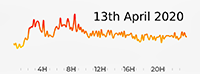 PM10 dominated. This level of pollution is worrying but not sure why?? The morning was worse than the rest of the day - deliveries getting ready for Tuesday perhaps? PM10 dominated. This level of pollution is worrying but not sure why?? The morning was worse than the rest of the day - deliveries getting ready for Tuesday perhaps? |
||
| 14th April | 15 | 28 | 1 | 5 | MODERATE | 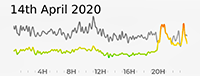 PM2.5 peaked after 8pm but otherwise this graph shows PM10 as the dominant particulate size. PM2.5 peaked after 8pm but otherwise this graph shows PM10 as the dominant particulate size. |
||
| 15th April | 27 | 37 | 28 | 8 | MODERATE | 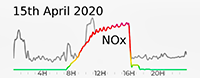 The 'block' of peaks throughout the day-time was dominated by NOx - picked out in th graph. Basically a toxic mix of all PMs and NOx. Background pollution for Swale was estimated as AQI 40 - our peak was in PM10 but also worrying levels of PM2.5 and NOx! Not a good day for walking! The 'block' of peaks throughout the day-time was dominated by NOx - picked out in th graph. Basically a toxic mix of all PMs and NOx. Background pollution for Swale was estimated as AQI 40 - our peak was in PM10 but also worrying levels of PM2.5 and NOx! Not a good day for walking! |
||
| 16th April | 42 | 41 | 3 | 13 | MODERATE | 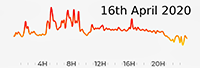 Even without this evidence, my impression has been that more traffic has passed us this day - more cars. PM2.5 and PM10 tracked each other throughout the day. Background pollution for Swale was estimated as AQI 37 - so our higher roadside pollution is definitively traffic-related. Even without this evidence, my impression has been that more traffic has passed us this day - more cars. PM2.5 and PM10 tracked each other throughout the day. Background pollution for Swale was estimated as AQI 37 - so our higher roadside pollution is definitively traffic-related. |
||
| 17th April | 19 | 42 | 1 | 13 | MODERATE |  I confess I thought traffic was heavier during our daily walk again. Quite what, if anything, this means is open to conjecture. Background pollution for Swale was estimated as AQI 39 - so our higher roadside pollution is definitively traffic-related. I confess I thought traffic was heavier during our daily walk again. Quite what, if anything, this means is open to conjecture. Background pollution for Swale was estimated as AQI 39 - so our higher roadside pollution is definitively traffic-related. |
||
| 18th April | 21 | 50 | 2 | 13 | HIGH | EXCEEDANCE |
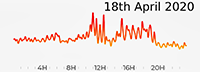 A score of "50" (PM10) is technically an exceedance but it is at the margin. Nevertheless, pollution was significant throughout the day - enough to be toxic over 24-hours. Background pollution for Swale was estimated as AQI 36 - so our higher roadside pollution is definitively traffic-related. A score of "50" (PM10) is technically an exceedance but it is at the margin. Nevertheless, pollution was significant throughout the day - enough to be toxic over 24-hours. Background pollution for Swale was estimated as AQI 36 - so our higher roadside pollution is definitively traffic-related. |
|
| 19th April | 18 | 43 | 1 | 12 | MODERATE | 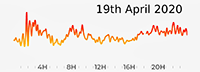 PM10 figures continue to dominate with PM2.5 continuing at a troubling level.. PM10 figures continue to dominate with PM2.5 continuing at a troubling level.. |
||
| 20th April | 18 | 47 | 1 | 12 | MODERATE | 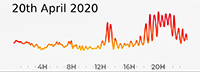 Very much dominated by PM10. PM2.5 was mirroring the graph line but significantly lower. However there was a bulge in the evening - not sure why? Also at lunchtime? Very much dominated by PM10. PM2.5 was mirroring the graph line but significantly lower. However there was a bulge in the evening - not sure why? Also at lunchtime? |
||
| 21st April | 18 | 42 | 0 | 12 | MODERATE | 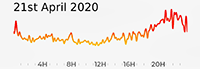 Very much dominated by PM10. PM2.5 was mirroring the graph line but significantly lower. The 'ripple' all day reflects the traffic lights regulating the flow. Very much dominated by PM10. PM2.5 was mirroring the graph line but significantly lower. The 'ripple' all day reflects the traffic lights regulating the flow. |
||
| 22nd April | 21 | 33 | 1 | 12 | MODERATE | 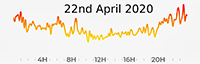 Very much dominated by PM10. PM2.5 was mirroring the graph line but significantly lower. Very much dominated by PM10. PM2.5 was mirroring the graph line but significantly lower. |
||
| 23rd April | 26 | 29 | 1 | 13 | MODERATE | 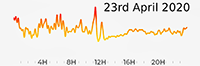 As above but also note that the normal peaks and troughs when there is no Covid-19 are not evident - this does suggest that most people are still staying at home. As above but also note that the normal peaks and troughs when there is no Covid-19 are not evident - this does suggest that most people are still staying at home. |
||
| 24th April | 23 | 27 | 2 | 12 | MODERATE | 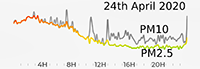 As above but note how pollution declined all day. The higher overnight/morning figures were shared equally between PM2.5 and PM10. As above but note how pollution declined all day. The higher overnight/morning figures were shared equally between PM2.5 and PM10. |
||
| 25th April | 15 | 31 | 1 | 10 | MODERATE | 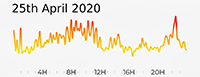 Saturday. PM10 Strongly dominant. Bulge in traffic throughout the morning, lower in pm. Saturday. PM10 Strongly dominant. Bulge in traffic throughout the morning, lower in pm. |
||
| 26th April | 14 | 22 | 1 | 12 | MODERATE | 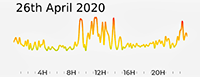 Sunday. Bulge through the middle of the day (9am-2pm) Sunday. Bulge through the middle of the day (9am-2pm) |
||
| 27th April | 18 | 21 | 2 | 15 | LOW/ MODERATE | 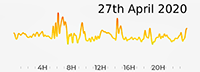 A fraction short of GOOD. VOC high throughout daylight hours. A fraction short of GOOD. VOC high throughout daylight hours. |
||
| 28th April | 14 | 29 | 1 | 12 | MODERATE | 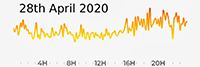 PM10 Strongly dominant. PM10 Strongly dominant. |
||
| 29th April | 12 | 26 | 0 | 19 | MODERATE | 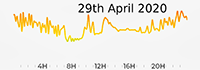 PM10 Strongly dominant. PM2.5 peaks 11am and 11pm! PM10 Strongly dominant. PM2.5 peaks 11am and 11pm! |
||
| 30th April | 10 | 25 | 1 | 17 | MODERATE | 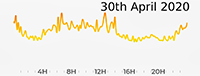 PM10 Dominant; PM2.5 tracking same pattern. PM10 Dominant; PM2.5 tracking same pattern. |
||
MAY 2020 |
||||||||
| 1st May | 10 | 23 | 2 | 14 | MODERATE | 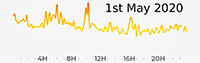 PM10 Dominant; PM2.5 tracking same pattern. PM10 Dominant; PM2.5 tracking same pattern. |
||
| 2nd May | 8 | 21 | 1 | 13 | LOW/ MODERATE | 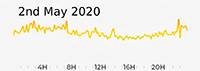 Saturday. A fraction short of GOOD. VOC high throughout daylight hours. Saturday. A fraction short of GOOD. VOC high throughout daylight hours. |
||
| 3rd May | 9 | 21 | 1 | 12 | LOW/ MODERATE |  Sunday. A fraction short of GOOD. VOC high throughout daylight hours. Sunday. A fraction short of GOOD. VOC high throughout daylight hours. |
||
| 4th May | 11 | 23 | 3 | 11 | MODERATE | 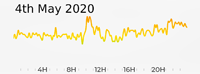 Usual 'sawtooth' throught the day. Usual 'sawtooth' throught the day. |
||
| 5th May | 11 | 28 | 1 | 9 | MODERATE | 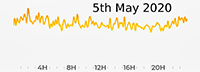 Usual 'sawtooth' throught the day. Usual 'sawtooth' throught the day. |
||
| 6th May | 15 | 30 | 1 | 11 | MODERATE | 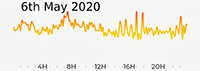 Some sharp spikes at the "high" end of pollution levels. Some sharp spikes at the "high" end of pollution levels. |
||
| 7th May | 14 | 24 | 1 | 18 | MODERATE | 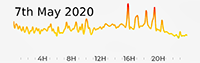 Pollution (PM10) upward-itrend in afternoon/evening. Pollution (PM10) upward-itrend in afternoon/evening. |
||
| 8th May | 16 | 25 | 2 | 16 | MODERATE | 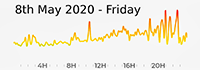 Signficant traffic pollution from 7pm to 11pm. Signficant traffic pollution from 7pm to 11pm. |
||
| 9th May | 29 | 36 | 3 | 14 | MODERATE | 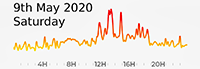 Saturday: Higher pollution from midday to 7pm; notably PM2.5 levels remained higher throughout the day Saturday: Higher pollution from midday to 7pm; notably PM2.5 levels remained higher throughout the day |
||
| 10th May | 22 | 27 | 2 | 11 | MODERATE | 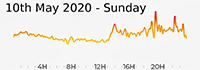 Sunday. Notable peaks all afternoon. drivers going home?. Sunday. Notable peaks all afternoon. drivers going home?. |
||
| 11th May | 12 | 32 | 3 | 5 | MODERATE | 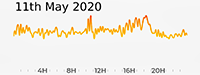 |
||
| 12th May | 12 | 29 | 3 | 12 | MODERATE | 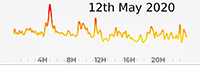 |
||
| 13th May | 11 | 26 | 3 | 9 | MODERATE |  |
||
| 14th May | 10 | 25 | 10 | 8 | MODERATE | 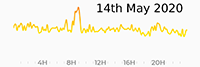 |
||
| 15th May | 10 | 23 | 2 | 13 | MODERATE |  |
||
| 16th May | 11 | 21 | 1 | 15 | LOW/ MODERATE | 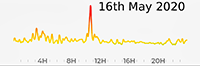 Saturday. Saturday. |
||
| 17th May | 11 | 24 | 0 | 22 | MODERATE | 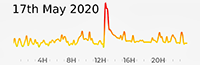 Sunday. The midday spike was VOC! Sunday. The midday spike was VOC! |
||
| 18th May | 12 | 23 | 0 | 20 | MODERATE | 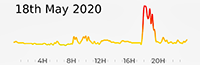 PM10 throughout, including early evening spikes. PM10 throughout, including early evening spikes. |
||
| 19th May | 10 | 21 | 1 | 21 | LOW/ MODERATE | 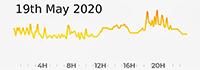 PM10 and PM2.5 mirrored eachother. PM10 and PM2.5 mirrored eachother. |
||
| 20th May | 8 | 18 | 2 | 19 | LOW |
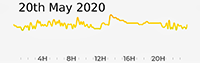 LOW Pollution coincides with roadworks/pavement cutting moves west of our sensors. LOW Pollution coincides with roadworks/pavement cutting moves west of our sensors. |
||
| 21st May | 10 | 19 | 1 | 17 | LOW |
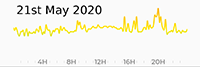 LOW Pollution coincides with roadworks/pavement cutting moves west of our sensors. LOW Pollution coincides with roadworks/pavement cutting moves west of our sensors. |
||
From 22nd May I will be using the latest Flow Device (FLOW 2), with which I have been shadowing the FLOW 1 sensor for several weeks and they are 'in step' with each other. The sensitivity/accuracy of the FLOW 2 has the same profile as the FLOW 1. |
||||||||
| 22nd May | 5 | 25 | 3 | 16 | MODERATE |  The spikey evening is principally PM10 The spikey evening is principally PM10 |
||
| 23rd May | 7 | 44 | 3 | 8 | MODERATE | 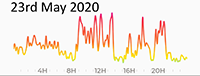 Saturday: Spikes of PM10 briefly exceeded the "VERY HIGH" level. But the average is 44. Saturday: Spikes of PM10 briefly exceeded the "VERY HIGH" level. But the average is 44. |
||
| 24th May | 7 | 34 | 23 | 8 | MODERATE | 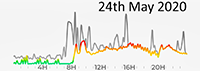 Sunday: It is worrying to see elevated levels of NOx from 8am. People out and about? Sunday: It is worrying to see elevated levels of NOx from 8am. People out and about? |
||
| 25th May | 5 | 23 | 16 | 8 | MODERATE | 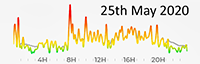 Dampened down particulates. Still a worrying mix. Dampened down particulates. Still a worrying mix. |
||
| 26th May | 5 | 19 | 15 | 10 | LOW |
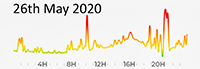 The measurement is right 'on the line', but is nearer to "safe" for us - just outside the AQMA5 zone. The measurement is right 'on the line', but is nearer to "safe" for us - just outside the AQMA5 zone. |
||
| 27th May | 4 | 15 | 8 | 8 | LOW |
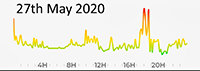 Much more emphatically a GOOD DAY! Much more emphatically a GOOD DAY! |
||
| 28th May | 6 | 35 | 8 | 4 | MODERATE | 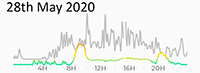 Roadworks in full swing and heavy traffic congested. Two 'humps' of PM2 - 8am-10am and 8pm-9pm are buried below this graph line. Roadworks in full swing and heavy traffic congested. Two 'humps' of PM2 - 8am-10am and 8pm-9pm are buried below this graph line. |
||
| 29th May | 6 | 38 | 7 | 7 | MODERATE | 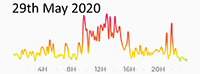 The traffic was bad throughout the working day, which explains the profile. A mixture of more cars than usual and the traffic lights. The traffic was bad throughout the working day, which explains the profile. A mixture of more cars than usual and the traffic lights. |
||
| 30th May | 5 | 25 | 13 | 12 | MODERATE | EXCEEDANCE 01.10 - 02.20 . |
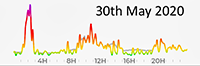 Saturday: The daily average was 25; but from 1.20am-2.20am there was an EXCEEDANCE at levels that are harmful if breathed for more than one hour! The two 'humps' in the middle of the day and evening are 'new normal'. Saturday: The daily average was 25; but from 1.20am-2.20am there was an EXCEEDANCE at levels that are harmful if breathed for more than one hour! The two 'humps' in the middle of the day and evening are 'new normal'. |
|
| 31st May | 4 | 15 | 14 | 14 | LOW |
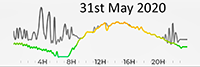 Sunday: What a difference a day makes! This proves just how useless SBC diffusion tubes are - they average our over days and weeks, when the good and the bad happen in hours and days. Sunday: What a difference a day makes! This proves just how useless SBC diffusion tubes are - they average our over days and weeks, when the good and the bad happen in hours and days. |
||
JUNE 2020 |
||||||||
| 1st June | 4 | 15 | 11 | 13 | LOW |
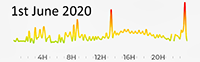 Another good day. BUT ... the Traffic Lights and workmen moved West. It will be interesting to see if there is an effect? Another good day. BUT ... the Traffic Lights and workmen moved West. It will be interesting to see if there is an effect? |
||
| 2nd June | 4 | 16 | 23 | 14 | LOW |
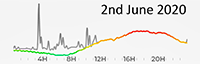 I spoke too soon! NOx reared its ugly head again through the normal working day. The 03.00am spike was PM10. I spoke too soon! NOx reared its ugly head again through the normal working day. The 03.00am spike was PM10. |
||
| 3rd June | 4 | 11 | 11 | 13 | LOW |
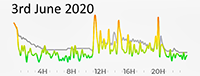 No wonder that my jog along the Lower Road was easier! Well, relatively easier. The pollutants PM10, NOx and VOCs were roughly eaual all day. No wonder that my jog along the Lower Road was easier! Well, relatively easier. The pollutants PM10, NOx and VOCs were roughly eaual all day. |
||
| 4th June | 4 | 11 | 6 | 10 | LOW |
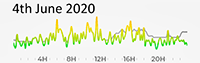 Another good day! There was an afternoon 'hump' of NOx. Another good day! There was an afternoon 'hump' of NOx. |
||
| 5th June | 4 | 12 | 7 | 15 | LOW |
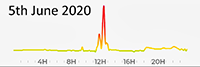 The midday spike was midday when the traffic came to something of a halt. It is interesting how suddenly that effect kicks in. The midday spike was midday when the traffic came to something of a halt. It is interesting how suddenly that effect kicks in. |
||
| 6th June | 5 | 16 | 4 | 15 | LOW |
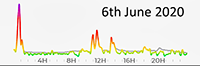 Saturday: All the spikes were PM10, with a massive (short) spike just after midnight? I can only speculate someone idling outside our house? Saturday: All the spikes were PM10, with a massive (short) spike just after midnight? I can only speculate someone idling outside our house? |
||
| 7th June | 4 | 9 | 0 | 10 | DUFF DATA |  Incomplete data. The sensor ran out of battery power. Incomplete data. The sensor ran out of battery power. |
||
| 8th June | 5 | 21 | 5 | 13 | MODERATE | 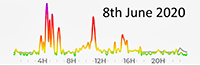 On the margin with Low. But, you will notice the massive peaks in PM10 from 3.30 to 6.30am. I assume there were problems on the M2? On the margin with Low. But, you will notice the massive peaks in PM10 from 3.30 to 6.30am. I assume there were problems on the M2? |
||
| 9th June | 4 | 14 | 14 | 13 | LOW |
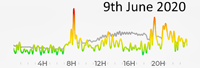 NOx built up during the day but not more than MODERATE. The spikes are PM10. NOx built up during the day but not more than MODERATE. The spikes are PM10. |
||
| 10th June | 4 | 18 | 5 | 14 | LOW |
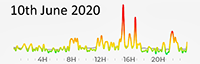 Spikes went HIGH for PM10. But daily average is nicely LOW. Spikes went HIGH for PM10. But daily average is nicely LOW. |
||
| 11th June | 5 | 22 | 2 | 12 | MODERATE | 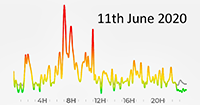 Dominated by spikes of PM10 that you would expect with traffic lights - nothing new. Dominated by spikes of PM10 that you would expect with traffic lights - nothing new. |
||
| 12th June | 4 | 18 | 9 | 14 | LOW |
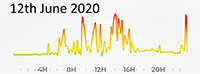 Dominated by spikes of PM10 that you would expect with traffic lights - nothing new. Dominated by spikes of PM10 that you would expect with traffic lights - nothing new. |
||
| 13th June | 4 | 14 | 13 | 16 | LOW |
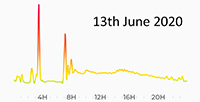 Saturday: VERY unusual shape to the PM10 pollution. 3am spike was there, 7.30 peak as traffic got stuck ... and then nothing much at all! It was unexpectedly quiet. Great! Saturday: VERY unusual shape to the PM10 pollution. 3am spike was there, 7.30 peak as traffic got stuck ... and then nothing much at all! It was unexpectedly quiet. Great! |
||
| 14th June | 4 | 11 | 9 | 17 | LOW |
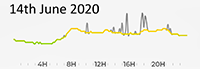 Sunday: Curiously, VOC's comprise the 'bulk' of pollution - peaks are PM10. Easing 'lock down' seems to coincide with people avoiding driving this weekend? Sunday: Curiously, VOC's comprise the 'bulk' of pollution - peaks are PM10. Easing 'lock down' seems to coincide with people avoiding driving this weekend? |
||
| 15th June | 4 | 12 | 9 | 16 | LOW |
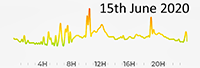 Peaks and troughs can be seen as traffic-lights at work. VOCs dominate Peaks and troughs can be seen as traffic-lights at work. VOCs dominate |
||
| 16th June | 4 | 10 | 8 | 16 | LOW |
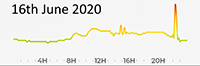 Peaks and troughs can be seen as traffic-lights at work.VOCs dominate Peaks and troughs can be seen as traffic-lights at work.VOCs dominate |
||
| 17th June | 4 | 10 | 7 | 13 | LOW |
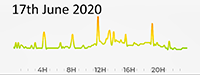 Peaks and troughs can be seen as traffic-lights at work.VOCs dominate Peaks and troughs can be seen as traffic-lights at work.VOCs dominate |
||
| 18th June | 4 | 12 | 1 | 13 | LOW |
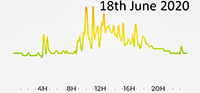 Peaks and troughs can be seen as traffic-lights at work.VOCs dominate Peaks and troughs can be seen as traffic-lights at work.VOCs dominate |
||
| 19th June | 4 | 11 | 5 | 13 | LOW |
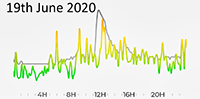 The taller 'lump' is still VOCs. The taller 'lump' is still VOCs. |
||
| 20th June | 4 | 12 | 9 | 14 | LOW |
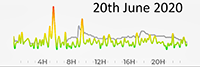 Saturday. The sharp peak is PM10. PM10 is the usual "swa-toothed" pattern that is resulting from traffic lights. Saturday. The sharp peak is PM10. PM10 is the usual "swa-toothed" pattern that is resulting from traffic lights. |
||
| 21st June | 4 | 16 | 5 | 12 | LOW |
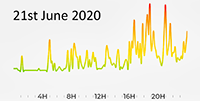 Sunday. The levels of pollution grew throughout the evening. THe road outside our house was very busy. Sunday. The levels of pollution grew throughout the evening. THe road outside our house was very busy. |
||
| 22nd June | 5 | 20 | 6 | 13 | MODERATE | 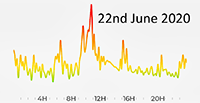 Right on the cusp, so still quite low even if technically MODERATE. The real 'damage' was done through the morning peaks. Right on the cusp, so still quite low even if technically MODERATE. The real 'damage' was done through the morning peaks. |
||
| 23rd June | 5 | 20 | 6 | 13 | MODERATE | 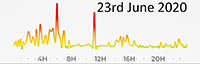 Almost exactly the same as yesterday in the pattern of the graph. We did have periods when the road was surprisingly busy at that time - traffic slow (and noisy - radios). Almost exactly the same as yesterday in the pattern of the graph. We did have periods when the road was surprisingly busy at that time - traffic slow (and noisy - radios). |
||
| 24th June | 4 | 15 | 3 | 11 | LOW |
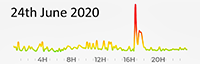 Significantly in the "Low" zone! OK, we have to thank the roadworks for persuading drivers to find alternatives - except that we do see large waves very early in the morning around 3 a.m. Significantly in the "Low" zone! OK, we have to thank the roadworks for persuading drivers to find alternatives - except that we do see large waves very early in the morning around 3 a.m. |
||
| 25th June | 4 | 13 | 2 | 12 | LOW |
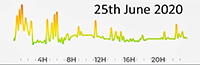 Good spread of Low pollution averaged over the day but much higher in the small hours with large lorries thundering through - until held up by lights and they just keep thrumming engines. Good spread of Low pollution averaged over the day but much higher in the small hours with large lorries thundering through - until held up by lights and they just keep thrumming engines. |
||
| 26th June | 5 | 19 | 0 | 19 | LOW |
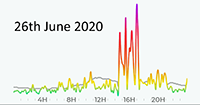 At the cusp between Low/Moderate. Afternoon and evening traffic reached dangerous peaks of "Very High" several times.. At the cusp between Low/Moderate. Afternoon and evening traffic reached dangerous peaks of "Very High" several times.. |
||
| 27th June | 4 | 15 | 1 | 12 | LOW |
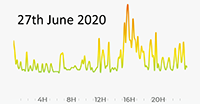 All good except from mid-afternoon to early evening peaks. All good except from mid-afternoon to early evening peaks. |
||
| 28th June | 5 | 18 | 4 | 12 | LOW |
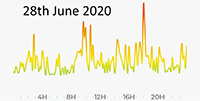 The peaks are becoming familiar. Sadly, early mornings are here to stay as the A2 becomes a run through to our towns and Medway towns. The peaks are becoming familiar. Sadly, early mornings are here to stay as the A2 becomes a run through to our towns and Medway towns. |
||
| 29th June | 5 | 18 | 4 | 12 | LOW |
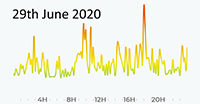 Ditto. Ditto. |
||
| 30th June | 4 | 16 | 1 | 13 | LOW |
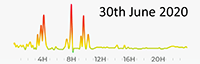 Again, the average for 24 hours is good, but midnight to midday was horrible. Again, the average for 24 hours is good, but midnight to midday was horrible. |
||
JULY 2020 |
||||||||
| 1st July | 4 | 14 | 9 | 14 | LOW |
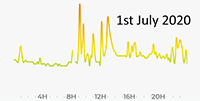 Good. Less so in the middle of the day Good. Less so in the middle of the day |
||
| 2nd July | 6 | 21 | 5 | 14 | MODERATE | 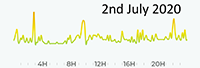 OK. I am fed up with disturbed nights and dangerous spikes in pollution as heavy goods vehicles career through in the early hours. Perhaps the M2 is being worked on? OK. I am fed up with disturbed nights and dangerous spikes in pollution as heavy goods vehicles career through in the early hours. Perhaps the M2 is being worked on? |
||
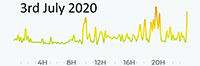
| 3rd July | 4 | 14 | 5 | 12 | LOW |
 In contrast to yesterday - a very good day throughout! Who knew!? In contrast to yesterday - a very good day throughout! Who knew!? |
||
| 4th July | 4 | 13 | 3 | 12 | LOW |
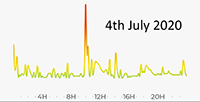 Surprising peak at 10am. But otherwise excellent! Surprising peak at 10am. But otherwise excellent! |
||
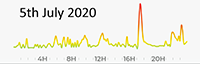
| 5th July | 6 | 16 | 3 | 13 | LOW |
 Peak at 6pm. Otherwise pretty excellent! Regional background pollution was low too. Peak at 6pm. Otherwise pretty excellent! Regional background pollution was low too. |
||
| 6th July | 6 | 27 | 12 | 10 | MODERATE | 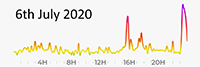 Very High extended peak towards midnight. PM10 with higher NOx measurement. Very High extended peak towards midnight. PM10 with higher NOx measurement. |
||
| 7th July | 7 | 21 | 8 | 13 | MODERATE | 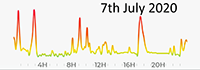 Early morning pollution peaks yet again. Not sure of M2 works in hand? Early morning pollution peaks yet again. Not sure of M2 works in hand? |
||
| 8th July | 4 | 14 | 2 | 14 | LOW |
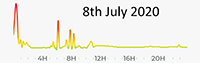 Regional pollution was low as well. Very early morning peak/midnight-1am.. Regional pollution was low as well. Very early morning peak/midnight-1am.. |
||
| 9th July | 4 | 14 | 4 | 12 | LOW |
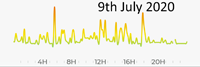 Peaky. Peaky. |
||
| 10th July | 4 | 15 | 3 | 8 | LOW |
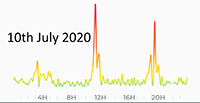 Another exmaple where the 24-hour measurement misses horribly high pollution peaks. Another exmaple where the 24-hour measurement misses horribly high pollution peaks. |
||
| 11th July | 4 | 15 | 11 | 9 | LOW |
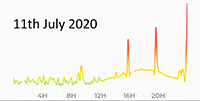 Another good day with some high peaks. Another good day with some high peaks. |
||
| 12th July | 5 | 17 | 15 | 11 | LOW |
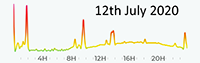 Again, once traffic builds up even modestly, a peak of surging pollution bites. Again, once traffic builds up even modestly, a peak of surging pollution bites. |
||
| 13th July | 5 | 21 | 7 | 15 | MODERATE | 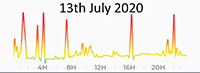 Several High peaks throughout day and night. Several High peaks throughout day and night. |
||
| 14th July | 5 | 17 | 2 | 12 | LOW |
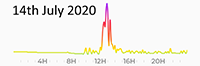 Dreadful middy peaks as traffic came to a grinding queue. Dreadful middy peaks as traffic came to a grinding queue. |
||
| 15th July | 4 | 13 | 5 | 14 | LOW |
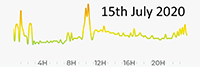 No serious peaks although early morning is still very busy to 3am. No serious peaks although early morning is still very busy to 3am. |
||
| 16th July | 4 | 11 | 5 | 13 | LOW |
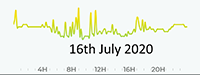 Clean day - OK PM doesn't have a 'safe' lower limit. Clean day - OK PM doesn't have a 'safe' lower limit. |
||
| 17th July | 5 | 15 | 5 | 16 | LOW |
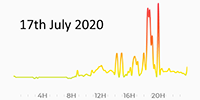 Today's problems took place from 7pm to 8.30pm. Otherwise fine. Today's problems took place from 7pm to 8.30pm. Otherwise fine. |
||
| 18th July | 5 | 14 | 1 | 15 | LOW |
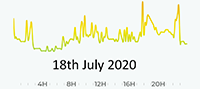 Fairly calm low pollution. Fairly calm low pollution. |
||
| 19th July | 4 | 12 | 1 | 10 | LOW |
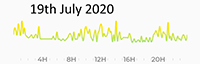 A good day all round. A good day all round. |
||
| 20th July | 5 | 19 | 14 | 9 | LOW |
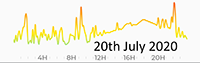 Marginal. Peaks at usual times. Overnight does appear to be following a pattern - including loss of sleep. Marginal. Peaks at usual times. Overnight does appear to be following a pattern - including loss of sleep. |
||
| 21st July | 5 | 23 | 14 | 10 | MODERATE | 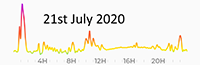 So much for sleep! Heavy pollution too - anyone sleeping with windows open gets this regularly fed to them. So much for sleep! Heavy pollution too - anyone sleeping with windows open gets this regularly fed to them. |
||
| 22nd July | 4 | 13 | 7 | 15 | LOW |
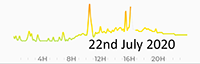 Pretty well OK. Low pollution. Pretty well OK. Low pollution. |
||
| 23rd July | 5 | 17 | 3 | 16 | LOW |
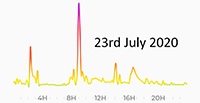 The 24-hour numbers look OK ... but take a look at the 9am spike! Agricultural movements. The 24-hour numbers look OK ... but take a look at the 9am spike! Agricultural movements. |
||
| 24th July | 4 | 13 | 2 | 15 | LOW |
 A good day and night. A good day and night. |
||
| 25th July | 4 | 12 | 0 | 12 | LOW |
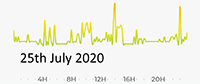 Excellent measurements. Lowish spikes. Excellent measurements. Lowish spikes. |
||
| 26th July | 4 | 15 | 7 | 10 | LOW |
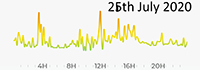 Apart from early morning lorry traffic, pollution was OK! Apart from early morning lorry traffic, pollution was OK! |
||
| 27th July | 5 | 15 | 2 | 13 | LOW |
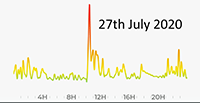 Short-lived peak of traffic congestion at 11am onwards. Short-lived peak of traffic congestion at 11am onwards. |
||
| 28th July | 4 | 14 | 8 | 12 | LOW |
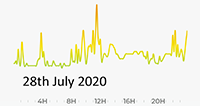 Peaks at expected times. Peaks at expected times. |
||
| 29th July | 4 | 16 | 8 | 12 | LOW |
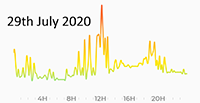 Heavier than usua traffic under current roadworks conditions during middle of the day Heavier than usua traffic under current roadworks conditions during middle of the day |
||
| 30th July | 6 | 21 | 5 | 14 | MODERATE | 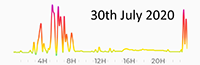 Average for 24 hours was marginal but the heavy goods and others travelling through AQMA5 all night was appalling - regularly High Pollution. Average for 24 hours was marginal but the heavy goods and others travelling through AQMA5 all night was appalling - regularly High Pollution. |
||
| 31st July | 4 | 11 | 2 | 33 | 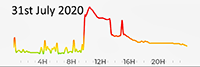 VOC strangely on the high side of Moderate. VOC strangely on the high side of Moderate. |
|||
| AUGUST 2020 | ||||||||
| 1st August | 8 | 20 | 1 | 17 | 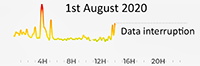 Data Interruption p.m. Power Connection Lost Data Interruption p.m. Power Connection Lost |
|||
| 2nd August | 0 | 0 | 8 | 16 | Public Data - Background estimates for our area. No Flow data | |||
| 3rd August | 9 | 8 | 9 | 19 | Public Data - Background estimates for our area. No Flow data | |||
| 4th August | 8 | 20 | 5 | 10 | 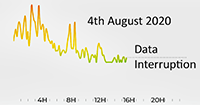 Data Interruption p.m. Data Interruption p.m. |
|||
| 5th August | 5 | 18 | 4 | 12 | 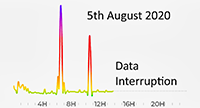 Spikes of heavy pollution. Data Loss in p.m. Spikes of heavy pollution. Data Loss in p.m. |
|||
| 6th August | 10 | 10 | 10 | 22 | Public Data - Background estimates for our area. No Flow data | |||
| 7th August | 8 | 19 | 1 | 13 | LOW |
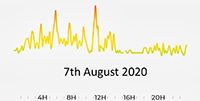 Normal Service resumed! Peaks throughout the day reflects flow of traffic. Normal Service resumed! Peaks throughout the day reflects flow of traffic. |
||
| 8th August | 17 | 22 | 0 | 13 | MODERATE | 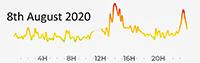 Mid afternoon saw prolonged congestion and heavy traffic levels. Mid afternoon saw prolonged congestion and heavy traffic levels. |
||
| 9th August | 5 | 28 | 0 | 11 | MODERATE | 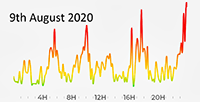 Pollution levels rose markedly this day. Multiple peaks at 'regular' times Pollution levels rose markedly this day. Multiple peaks at 'regular' times |
||
| 10th August | 6 | 32 | 0 | 13 | MODERATE | 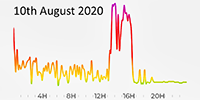 A dangerously high period between midday and 4pm. Traffic weight led to congestion building up suddenly. All morning slow traffic. A dangerously high period between midday and 4pm. Traffic weight led to congestion building up suddenly. All morning slow traffic. |
||
| 11th August | 28 | 18 | 0 | 12 | MODERATE | 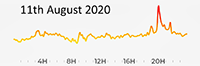 PM2.5 is higher and more dangerous as there is no 'safe lower limit'. Light variable winds - NE - NNE PM2.5 is higher and more dangerous as there is no 'safe lower limit'. Light variable winds - NE - NNE |
||
| 12th August | 33 | 22 | 0 | 12 | MODERATE |  PM2.5 is again dangerously high throughout the day. Light variable winds. PM2.5 is again dangerously high throughout the day. Light variable winds. |
||
| 13th August | 25 | 18 | 0 | 12 | MODERATE |  This run of fine PM2.5 pollution is worrying. Again, plenty of traffic throughout the day. Light variable winds. This run of fine PM2.5 pollution is worrying. Again, plenty of traffic throughout the day. Light variable winds. |
||
| 14th August | 4 | 7 | 3 | 11 | LOW |
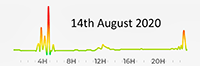 Wind picked up and changed direction to WNW-NW. This may explain the sudden drop in pollution. Yet again - 3-4am early peaks. Wind picked up and changed direction to WNW-NW. This may explain the sudden drop in pollution. Yet again - 3-4am early peaks. |
||
| 15th August | 23 | 29 | 0 | 12 | MODERATE | 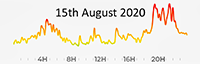 Both types of Particulate Matter represented again. Both types of Particulate Matter represented again. |
||
| 16th August | 5 | 16 | 0 | 11 | LOW |
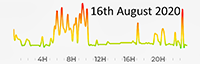 Sunday morning people on the move, but congesting in AQMA5 in the morning only with occasional peaks later. Sunday morning people on the move, but congesting in AQMA5 in the morning only with occasional peaks later. |
||
| 17th August | 4 | 16 | 1 | 13 | LOW |
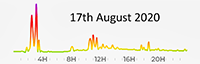 Another example of early morning heavy traffic passing through Greenstreet. Background pollution remains low. Peaks of PM10 at usual times. Another example of early morning heavy traffic passing through Greenstreet. Background pollution remains low. Peaks of PM10 at usual times. |
||
| 18th August | 5 | 15 | 1 | 13 | LOW |
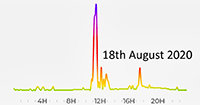 PM10 massive peak between 11-11.30am. Traffic almost at a standstill - took a while to free up. PM10 massive peak between 11-11.30am. Traffic almost at a standstill - took a while to free up. |
||
| 19th August | 9 | 21 | 1 | 12 | MODERATE | 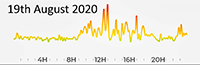 Most of the late morning into the afternoon we saw higher levels of traffic. Most of the late morning into the afternoon we saw higher levels of traffic. |
||
| 20th August | 4 | 14 | 1 | 15 | LOW |
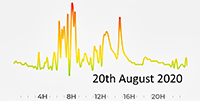 Traffic throughout the working day was 'pulsing' in peaks but early and late the pollution was Low. Average was "Low". Midday to 4pm was VOC peaks. Traffic throughout the working day was 'pulsing' in peaks but early and late the pollution was Low. Average was "Low". Midday to 4pm was VOC peaks. |
||
| 21st August | 5 | 23 | 0 | 13 | MODERATE | 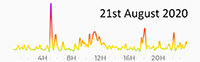 Usual peaks, with highest early morning. Usual peaks, with highest early morning. |
||
| 22nd August | 11 | 27 | 1 | 12 | MODERATE | EXCEEDANCE! 10.00 - 11.00 . |
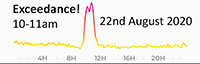 A busy day on the road with a very heavy traffic-loading before midday - enough to register as an "exceedance" of safe pollution over one hour. You could taste it ... after so many relatively good days. A busy day on the road with a very heavy traffic-loading before midday - enough to register as an "exceedance" of safe pollution over one hour. You could taste it ... after so many relatively good days. |
|
| 23rd August | 4 | 15 | 6 | 11 | LOW |
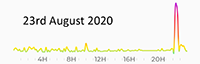 Curious spike of PM10 from 1045pm to just after 11pm? Otherwise, this was a very good day! Curious spike of PM10 from 1045pm to just after 11pm? Otherwise, this was a very good day! |
||
| 24th August | 5 | 20 | 5 | 14 | MODERATE | 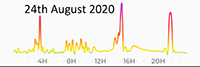 PM10 dominating the peaks during the day. PM10 dominating the peaks during the day. |
||
| 25th August | 5 | 24 | 1 | 12 | MODERATE | 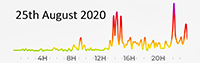 Early good day becoming progressively much worse. Early good day becoming progressively much worse. |
||
| 26th August | 5 | 21 | 4 | 12 | MODERATE | 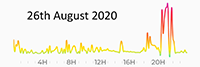 Pollution much higher overnight for extended period. Pollution much higher overnight for extended period. |
||
| 27th August | 5 | 21 | 3 | 11 | MODERATE | 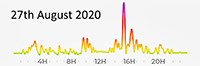 The average "Moderate" is created by larger peaks over a reasonable period. The average "Moderate" is created by larger peaks over a reasonable period. |
||
| 28th August | 10 | 24 | 1 | 12 | MODERATE | 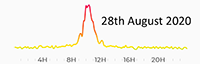 Late morning extended peak of PM10. Late morning extended peak of PM10. |
||
| 29th August | 10 | 26 | 1 | 9 | MODERATE |  Uncomfortable levels of PM2.5. Uncomfortable levels of PM2.5. |
||
| 30th August | 6 | 30 | 4 | 8 | MODERATE | EXCEEDANCE! 06.27 - 07.40 . |
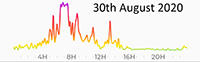 PM10 Exceedance of dangerous "very high" pollution for more than an hour. PM10 Exceedance of dangerous "very high" pollution for more than an hour. |
|
| 31st August | 4 | 11 | 6 | 10 | LOW |
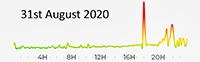 A good Monday to be out and about during daylight. A good Monday to be out and about during daylight. |
||
| SEPTEMBER 2020 | ||||||||
| 1st Sept | 4 | 12 | 6 | 12 | LOW |
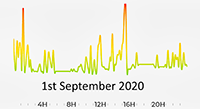 These peaks are at very low levels of pollution, another very good day to be out and about. These peaks are at very low levels of pollution, another very good day to be out and about. |
||
| 2nd Sept | 5 | 15 | 6 | 22 | MODERATE |  Unusually high levels of VOC between 1-2pm. Higher PM10 early morning and later (8pm). The roadworks have been cleared for a few days now, so levels may change up again? wait and see. Unusually high levels of VOC between 1-2pm. Higher PM10 early morning and later (8pm). The roadworks have been cleared for a few days now, so levels may change up again? wait and see. |
||
| 3rd Sept | 4 | 13 | 7 | 20 | MODERATE |  Figures made "Moderate" by VOC levels, otherwise fairly Low. Figures made "Moderate" by VOC levels, otherwise fairly Low. |
||
| 4th Sept | 4 | 17 | 4 | 17 | LOW |
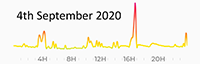 Another dip in pollution. Very welcome for jogging! Another dip in pollution. Very welcome for jogging! |
||
| 5th Sept | 4 | 20 | 5 | 11 | MODERATE |  Saturday: another 'day of two halves!' Nasty morning but the afternoon was good. Borne out by a jog along the A2! Saturday: another 'day of two halves!' Nasty morning but the afternoon was good. Borne out by a jog along the A2! |
||
| 6th Sept | 12 | 19 | 1 | 11 | LOW |
Yet again - enough traffic peaking at around 3am! Most is HGV - does anyone know what ferries arrive early doors? | ||
| 7th Sept | 14 | 22 | 1 | 12 | MODERATE | Avery prounounced peak at midday as the weight of traffic caused tail-backs. | ||
| 8th Sept | 11 | 14 | 0 | 16 | LOW |
Even distribution across the day. | ||
| 9th Sept | 14 | 21 | 1 | 13 | MODERATE | Another half-hour midday spike at "Very High". | ||
| 10th Sept | 15 | 29 | 4 | 9 | MODERATE | Very worrying levels (High and Very High) from 4pm untill midnight with stop-start traffic all evening. | ||
| 11th Sept | 14 | 21 | 1 | 11 | LOW |
Regular peaks throughout the day and night. | ||
| 12th Sept | 12 | 20 | 1 | 13 | MODERATE | Massive peak (High and Very High) around 6pm. | ||
| 13th Sept | 12 | 19 | 1 | 13 | LOW |
Regular peaks throughout the day and night. | ||
| 14th Sept | 15 | 19 | 1 | 11 | LOW |
Regular peaks throughout the day and night. | ||
| 15th Sept | 28 | 25 | 0 | 13 | MODERATE | Two major peaks of PM10; PM2.5 was at very worrying levels throughout the day. | ||
| 16th Sept | 24 | 28 | 1 | 12 | MODERATE | The peaks were PM10; PM2.5 was more evenly spread at a worrying level. | ||
| 17th Sept | 14 | 28 | 2 | 10 | MODERATE | PM10 was the main culprit throughout day and night. | ||
| 18th Sept | 13 | 24 | 0 | 10 | MODERATE | Worrying peaks from midday to 6pm. | ||
| 19th Sept | 13 | 22 | 0 | 13 | MODERATE | Regular peaks throughout the day and night. | ||
| 20th Sept | 15 | 23 | 0 | 12 | MODERATE | Regular peaks throughout the day and night. | ||
| 21st Sept | 16 | 17 | 1 | 12 | LOW |
Stable pollution levels - good news! | ||
| 22nd Sept | 16 | 16 | 0 | 15 | LOW |
Stable pollution levels - good news! A couple of stand-out peaks but not too bad. | ||
| 23rd Sept | 14 | 20 | 0 | 15 | MODERATE | From 7pm to midnight, the sharp peaks ruined an otherwise good day. | ||
| 24th Sept | 13 | 21 | 3 | 11 | MODERATE | Worrying peaks due to congestion around midday and again around 6-7pm. | ||
| 25th Sept | 14 | 18 | 2 | 7 | LOW | 50% of Data lost - connection issues | ||
| 26th Sept | 23 | 20 | 0 | 12 | MODERATE | Single high peak of both PM2.5 and PM10 at 3am in the morning. | ||
| 27th Sept | 0 | 0 | 5 | 20 | MODERATE | BACKGROUND POLLUTION Estimated Swale | ||
| 28th Sept | 15 | 14 | 16 | 5 | LOW | BACKGROUND POLLUTION Estimated Swale | ||
| 29th Sept | 0 | 1 | 11 | 15 | LOW | BACKGROUND POLLUTION Estimated Swale | ||
| 30th Sept | 0 | 0 | 0 | 30 | MODERATE | BACKGROUND POLLUTION Estimated Swale | ||
| OCTOBER 2020 | ||||||||
| 1st Oct | 0 | 0 | 2 | 31 | MODERATE | BACKGROUND POLLUTION Estimated Swale | ||
| 2nd Oct | 0 | 0 | 5 | 24 | MODERATE | BACKGROUND POLLUTION Estimated Swale | ||
| 3rd Oct | 0 | 0 | 2 | 35 | MODERATE | BACKGROUND POLLUTION Estimated Swale | ||
| 4th Oct | 5 | 5 | 9 | 11 | LOW | BACKGROUND POLLUTION Estimated Swale | ||
| 5th Oct | 0 | 0 | 3 | 25 | MODERATE | BACKGROUND POLLUTION Estimated Swale | ||
| 6th Oct | 1 | 2 | 5 | 17 | LOW | BACKGROUND POLLUTION Estimated Swale | ||
| 7th Oct | 0 | 0 | 2 | 30 | MODERATE | BACKGROUND POLLUTION Estimated Swale | ||
| 8th Oct | 12 | 9 | 17 | 1 | LOW | BACKGROUND POLLUTION Estimated Swale | ||
| 9th Oct | 0 | 0 | 12 | 10 | LOW | BACKGROUND POLLUTION Estimated Swale | ||
| 10th Oct | 4 | 4 | 9 | 11 | LOW | BACKGROUND POLLUTION Estimated Swale | ||
| 11th Oct | 0 | 0 | 11 | 8 | LOW | BACKGROUND POLLUTION Estimated Swale | ||
| 12th Oct | 23 | 20 | 0 | 12 | MODERATE | FLOW RETURNS! AQMA5 roadside | ||
| 13th Oct | 17 | 18 | 0 | 11 | LOW | Pulses throughout the day (and night) | ||
| 14th Oct | 18 | 18 | 1 | 12 | LOW | Pulses throughout the day (and night) | ||
| 15th Oct | 16 | 20 | 1 | 12 | MODERATE | Pulses throughout the day (and night) | ||
| 16th Oct | 18 | 18 | 1 | 13 | LOW | PM2.5 &PM10 Peak at 18.30. | ||
| 17th Oct | 19 | 15 | 0 | 13 | LOW | Quieter early morning and mid afternoon (Saturday) | ||
| 18th Oct | 24 | 17 | 0 | 13 | MODERATE | Heaviest pollution 1900-2000 hrs | ||
| 19th Oct | 25 | 22 | 0 | 15 | MODERATE | Much heavier pulses of particulate pollution 1400-1800 hrs | ||
| 20th Oct | 20 | 26 | 0 | 18 | MODERATE | Major peaks PM10 from 0900 to midday | ||
| 21st Oct | 14 | 18 | 0 | 17 | LOW | Slightly higher very earl and again 0900-1000 hrs | ||
| 22nd Oct | 18 | 29 | 1 | 13 | MODERATE | Heavier pulses 0400-1100 hrs. HIGH pollution peaks 2200-midnight | ||
| 23rd Oct | 19 | 25 | 1 | 11 | MODERATE | Heaviest across midday and 2100-2300 hrs | ||
| 24th Oct | 19 | 25 | 1 | 13 | MODERATE | Very High peak 0500 hrs | ||
| 25th Oct | 19 | 22 | 2 | 10 | MODERATE | PM Peaks 0900-1100 hrs | ||
| 26th Oct | 15 | 19 | 0 | 10 | LOW | Pulsing all day with traffic flows | ||
| 27th Oct | 16 | 20 | 1 | 12 | MODERATE | Higher pollution in morning | ||
| 28th Oct | 16 | 21 | 1 | 15 | MODERATE | Even pulses throughout the period | ||
| 29th Oct | 17 | 25 | 0 | 14 | MODERATE | Even pulses throughout the period | ||
| 30th Oct | 14 | 21 | 0 | 16 | MODERATE | Quieter afternoon | ||
| 31st Oct | 19 | 25 | 1 | 12 | MODERATE | Pulsing throughout | ||
| NOVEMBER 2020 | ||||||||
| 1st Nov | 19 | 29 | 1 | 13 | MODERATE | 1810pm VERY HIGH peak of PM10. Otherwise Moderate. | ||
| 2nd Nov | 14 | 24 | 0 | 12 | MODERATE | Busy midday and late evening | ||
| 3rd Nov | 20 | 26 | 2 | 8 | MODERATE | 2230-2330pm HIGH Peak. Pulsing throughout at Moderate levels | ||
| 4th Nov | 31 | 37 | 17 | 5 | MODERATE | 1800-1830 VERY HIGH all PMs and NOx. Busy evening. | ||
| 5th Nov | 41 | 42 | 12 | 4 | MODERATE | LOCK DOWN 2 STARTS AND TRAFFIC DOESN'T CHANGE IN NEXT TWO WEEKS!: Pronounced pollution 0400-0500 and evening |
||
| 6th Nov | 43 | 42 | 4 | 7 | MODERATE | Evening and early periods polluted most. | ||
| 7th Nov | 44 | 38 | 10 | 10 | MODERATE | Yet again both PMs are peaking all day | ||
| 8th Nov | 46 | 43 | 1 | 15 | MODERATE | Foul air quality again. Worst between midday to 0800 hrs. | ||
| 9th Nov | 27 | 30 | 0 | 19 | MODERATE | 1150am PM10 at VERY HIGH | ||
| 10th Nov | 27 | 29 | 1 | 15 | MODERATE | 0200 -0400 hrs heaviest both PMs. | ||
| 11th Nov | 26 | 36 | 1 | 14 | MODERATE | Between 06.40 and 07.20 PM10 and PM2.5 VERY HIGH pollution levels were reached - 20 Minutes short of "exceedance". From 1400 to midnight there were continuous pulses of HIGH pollution. | ||
| 12th Nov | 21 | 26 | 1 | 12 | MODERATE | Overnight peaks finally dropped at 02.00am. The afternoon saw pulses of traffic congestion and peaks. | ||
| 13th Nov | 23 | 20 | 1 | 11 | MODERATE | Moderate peaks from midday. | ||
| 14th Nov | 26 | 21 | 0 | 15 | MODERATE | 1740-17.25 VERY HIGH POLLUTION - 15 minutes short of "Exceedance" (100+ on the Scale) | ||
| 15th Nov | 20 | 16 | 1 | 13 | Unremarkable. | |||
| 16th Nov | 20 | 15 | 1 | 12 | Unremarkable. | |||
| 17th Nov | 22 | 24 | 0 | 20 | Large continuous peak - 10.30-midday. Otherwise ripples all day. | |||
| 18th Nov | 24 | 23 | 1 | 14 | ||||
| 19th Nov | 24 | 17 | 3 | 8 | ||||
| 20th Nov | 5 | 18 | 4 | 8 | LOW | Flow I data interrupted. Flow II. Peak 8pm and at 18.30 - graph | ||
| 21st Nov | 4 | 9 | 10 | 17 | LOW | FLOW II data and graph | ||
| 22nd Nov | 4 | 11 | 2 | 10 | LOW | FLOW II: Unremarkable. | ||
| 23rd Nov | 7 | 23 | 1 | 7 | MODERATE | FLOW II: 09.00-10.30: Lengthy Peak. Otherwise unremarkable | ||
| 24th Nov | 4 | 14 | 3 | 6 | LOW | FLOW II: Sharp PM 10 peak 1pm. Otherwise Low. | ||
| 25th Nov | 4 | 16 | 3 | 14 | LOW | FLOW II: Very High sharp Peak 04.00am only | ||
| 26th Nov | 26 | 20 | 1 | 12 | MODERATE | Flow I Data restored. | ||
| 27th Nov | 34 | 30 | 1 | 11 | MODERATE | |||
| 28th Nov | 48 | 43 | 4 | 14 | MODERATE | High Peaks pulsing all day and night. | ||
| 29th Nov | 39 | 30 | 2 | 12 | MODERATE | Escallating peaks from morning to evening | ||
| 30th Nov | 32 | 29 | 3 | 13 | MODERATE | Higher peaks reduced gradually to 10.00am. | ||
DECEMBER 2020 |
||||||||
| 1st Dec | 20 | 25 | 3 | 8 | MODERATE | Peaks from 8-10am. | ||
| 2nd Dec | 34 | 45 | 15 | 8 | MODERATE | EXCEEDANCE | VERY High Peaks midnight to 02.00am; Exceedance peaks of PM10: 16.25-18.25pm. | |
| 3rd Dec | 25 | 28 | 15 | 12 | MODERATE | VERY HIGH PEAKS of PM10 between 0620-8.40. Not an Exceedance as the level was not continuous. | ||
| 4th Dec | 23 | 18 | 7 | 11 | MODERATE | |||
| 5th Dec | 27 | 18 | 9 | 11 | MODERATE | |||
| 6th Dec | 27 | 16 | 8 | 12 | MODERATE | PM2.5 grew throughout the day. | ||
| 7th Dec | 40 | 31 | 2 | 10 | MODERATE | Both PMs increased through the day | ||
| 8th Dec | 47 | 36 | 9 | 12 | MODERATE | Very close to an all-day exceedance of PM2.5 | ||
| 9th Dec | 30 | 22 | 23 | 15 | MODERATE | |||
| 10th Dec | 26 | 20 | 5 | 15 | MODERATE | "Swell" of NOx from morning through the evening. | ||
| 11th Dec | 23 | 17 | 5 | 21 | MODERATE | Short VOC peal at midday | ||
| 12th Dec | 21 | 17 | 2 | 17 | MODERATE | |||
| 13th Dec | 32 | 22 | 20 | 14 | MODERATE | |||
| 14th Dec | 22 | 20 | 3 | 20 | MODERATE | Ripples all afternoon and peak at 8pm | ||
| 15th Dec | 23 | 21 | 1 | 12 | MODERATE | Sharp Peaks at 9am and midday | ||
| 16th Dec | 22 | 18 | 0 | 14 | MODERATE | Peak at 19.00pm | ||
| 17th Dec | 20 | 19 | 3 | 12 | MODERATE | Pulsing all day | ||
| 18th Dec | 22 | 18 | 0 | 14 | MODERATE | |||
| 19th Dec | 22 | 19 | 0 | 13 | MODERATE | Pulsing all day. | ||
| 20th Dec | 23 | 20 | 1 | 8 | MODERATE | PM10 Peak 0500am. | ||
| 21st Dec | 24 | 21 | 0 | 14 | MODERATE | TIGHTER LOCKDOWN ANNOUNCED. HIGH peak 1220-1410 - both PMs. | ||
| 22nd Dec | 21 | 19 | 0 | 14 | MODERATE | |||
| 23rd Dec | 23 | 17 | 0 | 13 | MODERATE | Flat until 1700pm peak to 1900. | ||
| 24th Dec | 18 | 17 | 0 | 4 | LOW | Moderate peak 0600-0800; Flat pulsing otherwise. | ||
| 25th Dec | 28 | 17 | 2 | 3 | MODERATE | Increasing PM2.5 from 1600-midnight | ||
| 26th Dec | 20 | 15 | 11 | 10 | MODERATE | 1110am-1250pm peak. Otherwise largely low pulses. | ||
| 27th Dec | 22 | 17 | 7 | 11 | MODERATE | Increasing from 2000 to midnight | ||
| 28th Dec | 31 | 21 | 2 | 5 | MODERATE | Early morning peak and late night. | ||
| 29th Dec | 35 | 20 | 2 | 5 | MODERATE | One peak at 1500pm. | ||
| 30th Dec | 37 | 24 | 9 | 6 | MODERATE | Significant peaks all day. | ||
| 31st Dec | 28 | 20 | 1 | 5 | MODERATE | Continuous pulsing all Day. | ||
2021 - JANUARY |
||||||||
| 1st Jan | 42 | 38 | 18 | 7 | MODERATE | High Peaks (PM10) from 1500-2200pm | ||
| 2nd Jan | 31 | 20 | 17 | 11 | MODERATE | Pulsing all day. Short peak 2130pm | ||
| 3rd Jan | 34 | 23 | 15 | 11 | MODERATE | Pulsing all day.Two sharp peaks early evening. | ||
| 4th Jan | 26 | 21 | 5 | 12 | MODERATE | Pulsing all day. Sharp peak at 2000pm | ||
| 5th Jan | 26 | 18 | 6 | 11 | MODERATE | One sharp peak 1000. Pulses all day. | ||
| 6th Jan | 27 | 16 | 9 | 12 | MODERATE | Saw-tooth profile all day. Distinct highs and lows ranges. | ||
| 7th Jan | 38 | 29 | 10 | 11 | MODERATE | Gradual rise high peak 1730-2045pm then sharp drop-off. | ||
| 8th Jan | 31 | 22 | 4 | 9 | MODERATE | Saw-tooth all day pulsing. | ||
| 9th Jan | 36 | 30 | 9 | 12 | MODERATE | Marked series of peaks into "Very High" from midday to 1600pm. Otherwise flat pulses. | ||
| 10th Jan | 31 | 25 | 9 | 11 | MODERATE | Saw-tooth all day. | ||
| 11th Jan | 28 | 22 | 19 | 41 | MODERATE | 900am to 1700pm High periods. | ||
| 12th Jan | 19 | 14 | 2 | 33 | MODERATE | Low all day to 1700 sharp peak. Pulses thereafter. | ||
| 13th Jan | 30 | 23 | 18 | 18 | MODERATE | High peaks and periods from 0400 to 1845pm. | ||
| 14th Jan | 23 | 15 | 0 | 13 | MODERATE | Pulsing all day | ||
| 15th Jan | 39 | 25 | 8 | 11 | MODERATE | Moderate with higher peaks through the evening | ||
| 16th Jan | 33 | 24 | 12 | 17 | MODERATE | Very busy peaks from minight to 1600p, then flat | ||
| 17th Jan | 24 | 21 | 4 | 15 | MODERATE | Sunday: Pulsing all day with peak 2300-midnight | ||
| 18th Jan | 22 | 17 | 33 | 16 | MODERATE | High from midday to 2200pm. | ||
| 19th Jan | 20 | 17 | 2 | 29 | MODERATE | Quiet except for peaks at 11-12midday; 1800 peak. | ||
| 20th Jan | 20 | 14 | 0 | 23 | MODERATE | Relatively quiet all day. | ||
| 21st Jan | 18 | 17 | 1 | 15 | LOW | Even distribution. Spikes at 7am and 5pm. | ||
| 22nd Jan | 24 | 21 | 12 | 9 | MODERATE | Even distribution in day; sharp up-ticks pm. | ||
| 23rd Jan | 32 | 21 | 3 | 6 | MODERATE | Even distribution | ||
| 24th Jan | 28 | 24 | 11 | 5 | MODERATE | Even. Spikes after 4pm | ||
| 25th Jan | 24 | 18 | 12 | 6 | MODERATE | Active ripples all day | ||
| 26th Jan | 27 | 21 | 17 | 12 | MODERATE | Sharp-toothed ripples all day. Bulge of NO2 from 4pm to 8pm. | ||
| 27th Jan | 29 | 21 | 7 | 21 | MODERATE | PM10 Peak from 7-9am. Otherwise even spread of shallow pulses all day. | ||
| 28th Jan | 18 | 15 | 13 | 30 | MODERATE | NO2 heavier from 11am to mid-afternoon | ||
| 29th Jan | 22 | 18 | 1 | 32 | MODERATE | VOC sustained peaks at 11-noon, 3-4 pm trailing off during the evening. | ||
| 30th Jan | 23 | 17 | 1 | 11 | MODERATE | Early morning peaks to 6am; Modest ripples thereafter. | ||
| 31st Jan | 38 | 25 | 6 | 7 | MODERATE | Average was raised by spikes at 8-9am and 8-10pm. | ||
2021 - FEBRUARY |
||||||||
| 1st Feb | 7 | 12 | 3 | 10 | LOW | Flat-lines early am and evning but higher through the business day. | ||
| 2nd Feb | 11 | 22 | 9 | 5 | MODERATE | Lumps of pollution from midday. | ||
| 3rd Feb | 6 | 22 | 6 | 26 | MODERATE | Sharp spike all night to 8-9am; huge spike of VOC 9-10pm. "22" is at margins of accuracy (+/- 10%) | ||
| 4th Feb | 25 | 20 | 3 | 15 | MODERATE | Marginal measurement at 24 hr period. | ||
| 5th Feb | 26 | 18 | 1 | 14 | MODERATE | Safely in-"Moderate" band. Pronounced lumps at times throughout. | ||
| 6th Feb | 32 | 22 | 3 | 11 | MODERATE | Spikes throughout. | ||
| 7th Feb | 19 | 17 | 0 | 4 | LOW | Marginal at "19" (+/- 10%). Spiky throughout. | ||
| 8th Feb | 11 | 15 | 0 | 4 | LOW | Safely in "LOW" | ||
| 9th Feb | 7 | 13 | 2 | 4 | LOW | Very good quality air. A couple of PM10 spikes - 7am and 12.30pm. | ||
| 10th Feb | 14 | 16 | 14 | 5 | LOW | Good air. A few spikes. | ||
| 11th Feb | 17 | 14 | 7 | 6 | LOW | Good air. Ripples throughout. | ||
| 12th Feb | 10 | 13 | 6 | 6 | LOW | Good air except two pronounce spikes at 8am and 4pm. | ||
| 13th Feb | 9 | 13 | 7 | 8 | LOW | Large VERY HIGH (241 !) spike at midday of NO2 | ||
| 14th Feb | 12 | 36 | 4 | 16 | MODERATE | Serious prolonged PM10 at VERY HIGH but just short of 1-hour | ||
| 15th Feb | 5 | 20 | 14 | 26 | MODERATE | VOC HIGH plateau 11am-2pm. | ||
| 16th Feb | 4 | 20 | 6 | 27 | MODERATE | VOC HIGH plateau 4-6.30pm. | ||
| 17th Feb | Data Dropout - power lead loose | |||||||
| 18th Feb | Data Dropout - power lead loose | |||||||
| 19th Feb | 19 | 19 | 8 | 13 | LOW | Partial data set - unreliable | ||
| 20th Feb | 24 | 28 | 0 | 15 | MODERATE | FLOW 1. Early am sharp spikes; calmer from midday | ||
| 21st Feb | 26 | 23 | 2 | 12 | MODERATE | FLOW 1. Higher early am to 10am. Rising again from 8pm. All Particulates. | ||
| 22nd Feb | 26 | 22 | 1 | 12 | MODERATE | FLOW 1. Saw-toothed all day. | ||
| 23rd Feb | 19 | 15 | 1 | 13 | LOW | PM2.5 is marginal (+/- 10%). However major Particulate spikes 3-4.30pm skew the day's data. | ||
| 24th Feb | 19 | 22 | 1 | 15 | MODERATE | Marginal. Swatoothed all day. | ||
| 25th Feb | 25 | 26 | 1 | 11 | MODERATE | All Particulates PM10 VERY HIGH spike at 7pm. | ||
| 26th Feb | 27 | 26 | 6 | 6 | MODERATE | Spiky all day. especially in the evening | ||
| 27th Feb | 34 | 25 | 8 | 5 | MODERATE | Bulge midday to 3pm; rising from 7pm to 10pm. | ||
| 28th Feb | 35 | 35 | 2 | 8 | MODERATE | PM10 VERY HIGH 10.13-30am | ||
