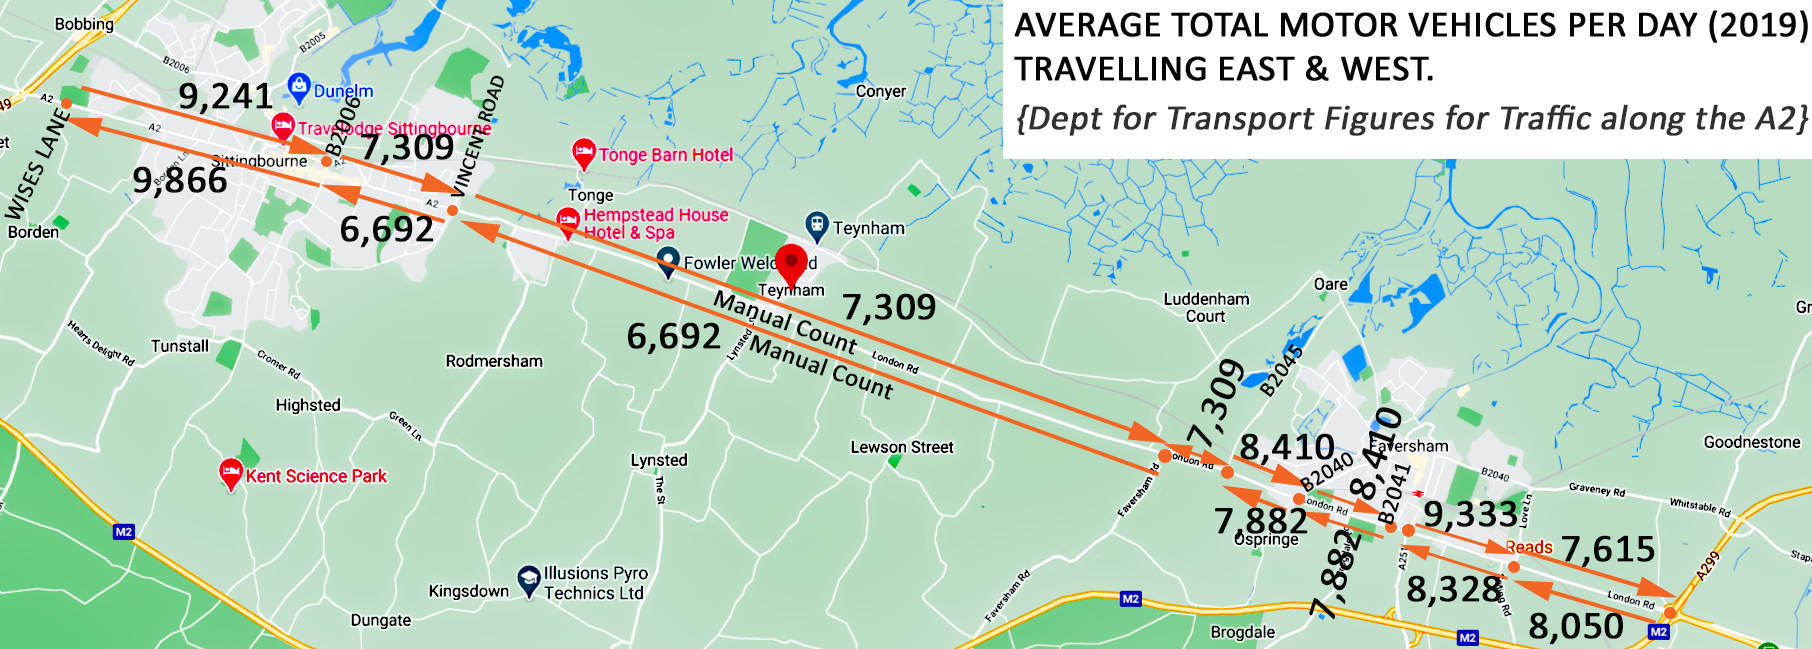
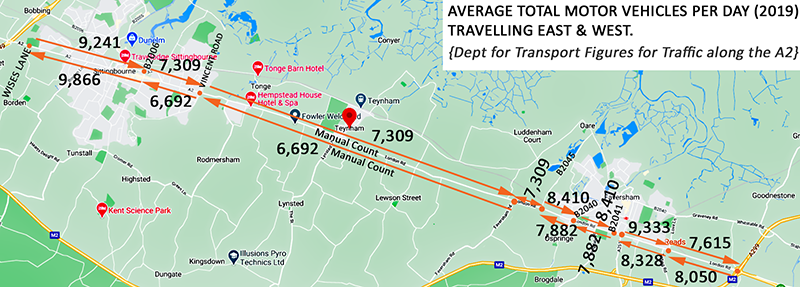
-- AVERAGE DAILY TRAFFIC FOR THE A2 BETWEEN A249 TO M2 (Brenley Corner) --
-- THIS MAP SHOWS 2019 FIGURES IN BOTH DIRECTIONS --
- A249 to Wises Lane (id 78312)
- Wises Lane to B2006 (id 36102)
- B2006 to Vincent Rd (id 78311)
- Vincent Road to Faversham Road (id 56095)
- Faversham Road to B2045 Western Way (id 78176)
- B2045 Western Link and B2040 Ospringe Rd (id 56100)
- B2040 and B2041 (id 28687)
- B2041 and A251 (Ashford Road) (id 8557)
- A251 and B2040 Love Lane (id 78206)
- B2040 Love Lane and M2 - (id 18400
NOTE: These tables add together the traffic in both directions. The Map above shows how these numbers break down into their direction of travel - East and West
Between A249(T) and Wises Lane, Sittingbourne -
Link length 0.50km (0.31 miles) - id 78312
| Year |
Count method |
Pedal
cycles |
Two wheeled
motor vehicles |
Cars and taxis |
Buses and coaches |
Light goods vehicles |
Heavy goods vehicles |
All motor vehicles |
| 2019 |
Estimated using previous year's AADF on this link |
83 |
148 |
15374 |
102 |
3046 |
437 |
19108 |
| 2018 |
Estimated using previous year's AADF on this link |
78 |
158 |
15184 |
101 |
3073 |
436 |
18952 |
| 2017 |
Estimated using previous year's AADF on this link |
69 |
160 |
15353 |
111 |
3017 |
429 |
19069 |
| 2016 |
Dependent on a neighbouring counted link |
72 |
158 |
15467 |
119 |
2866 |
427 |
19037 |
| 2015 |
Estimated using previous year's AADF on this link |
53 |
154 |
15042 |
256 |
3691 |
643 |
19786 |
| 2014 |
Estimated using previous year's AADF on this link |
57 |
174 |
14750 |
237 |
3520 |
663 |
19345 |
| 2013 |
Estimated using previous year's AADF on this link |
59 |
182 |
14361 |
247 |
3292 |
665 |
18746 |
| 2012 |
Estimated using previous year's AADF on this link |
60 |
164 |
14488 |
236 |
3167 |
662 |
18717 |
| 2011 |
Estimated using previous year's AADF on this link |
63 |
171 |
14718 |
217 |
3130 |
678 |
18914 |
| 2010 |
Estimated using previous year's AADF on this link |
57 |
202 |
14762 |
229 |
2804 |
665 |
18662 |
| 2009 |
Estimated from nearby links |
52 |
193 |
13514 |
184 |
2389 |
586 |
16866 |
| 2008 |
Estimated from nearby links |
51 |
172 |
13224 |
186 |
2355 |
637 |
16574 |
| 2007 |
Estimated from nearby links |
46 |
180 |
13521 |
214 |
2306 |
657 |
16878 |
| 2006 |
Estimated from nearby links |
118 |
192 |
13942 |
163 |
2236 |
479 |
17012 |
| 2005 |
Estimated from nearby links |
76 |
221 |
14212 |
175 |
2203 |
517 |
17328 |
| 2004 |
Estimated from nearby links |
89 |
102 |
14142 |
146 |
2469 |
634 |
17493 |
| 2003 |
Estimated from nearby links |
110 |
156 |
13961 |
178 |
2242 |
554 |
17091 |
| 2002 |
Estimated from nearby links |
83 |
119 |
13946 |
182 |
2255 |
682 |
17184 |
| 2001 |
Estimated from nearby links |
81 |
116 |
13727 |
180 |
2104 |
715 |
16842 |
| 2000 |
Estimated from nearby links |
85 |
205 |
12460 |
233 |
2087 |
768 |
15753 |
Between Wises Lane and B2006, Sittingbourne - Link length 2.20km (1.37 miles) - id 36102
| Year |
Count method |
Pedal cycles |
Two wheeled motor vehicles |
Cars and taxis |
Buses and coaches |
Light goods vehicles |
Heavy goods vehicles |
All motor vehicles |
| 2019 |
Estimated using previous year's AADF on this link |
83 |
148 |
15374 |
102 |
3046 |
437 |
19108 |
| 2018 |
Estimated using previous year's AADF on this link |
76 |
158 |
15184 |
101 |
3073 |
436 |
18952 |
| 2017 |
Estimated using previous year's AADF on this link |
69 |
160 |
15353 |
111 |
3017 |
429 |
19069 |
| 2016 |
Manual count |
72 |
158 |
15467 |
119 |
2866 |
427 |
19037 |
| 2015 |
Estimated using previous year's AADF on this link |
53 |
154 |
15042 |
256 |
3691 |
643 |
19786 |
| 2014 |
Estimated using previous year's AADF on this link |
57 |
174 |
14750 |
237 |
3520 |
663 |
19345 |
| 2013 |
Estimated using previous year's AADF on this link |
59 |
182 |
14361 |
247 |
3292 |
665 |
18746 |
| 2012 |
Estimated using previous year's AADF on this link |
60 |
164 |
14488 |
236 |
3167 |
662 |
18717 |
| 2011 |
Estimated using previous year's AADF on this link |
63 |
171 |
14718 |
217 |
3130 |
678 |
18914 |
| 2010 |
Estimated using previous year's AADF on this link |
57 |
202 |
14762 |
229 |
2804 |
665 |
18662 |
| 2009 |
Estimated using previous year's AADF on this link |
57 |
212 |
14851 |
202 |
2625 |
644 |
18534 |
| 2008 |
Estimated using previous year's AADF on this link |
57 |
190 |
14531 |
204 |
2587 |
701 |
18213 |
| 2007 |
Manual count |
51 |
198 |
14859 |
235 |
2534 |
722 |
18548 |
| 2006 |
Estimated using previous year's AADF on this link |
130 |
211 |
15321 |
179 |
2457 |
528 |
18696 |
| 2005 |
Manual count |
83 |
243 |
15617 |
193 |
2421 |
568 |
19042 |
| 2004 |
Estimated using previous year's AADF on this link |
98 |
113 |
15541 |
160 |
2713 |
696 |
19223 |
| 2003 |
Manual count |
121 |
171 |
15341 |
195 |
2464 |
609 |
18780 |
| 2002 |
Estimated using previous year's AADF on this link |
92 |
131 |
15325 |
200 |
2479 |
750 |
18885 |
| 2001 |
Manual count |
88 |
127 |
15084 |
198 |
2313 |
786 |
18508 |
| 2000 |
Estimated using previous year's AADF on this link |
93 |
226 |
13693 |
256 |
2293 |
845 |
17313 |
Between B2006 and Vincent Rd - Link length - 1.90km (1.18 miles) - id 78311
| Year |
Count method |
Pedal cycles |
Two wheeled motor vehicles |
Cars and taxis |
Buses and coaches |
Light goods vehicles |
Heavy goods vehicles |
All motor vehicles |
| 2019 |
Dependent on a neighbouring counted link |
19 |
106 |
11045 |
84 |
2275 |
492 |
14001 |
| 2018 |
Estimated using previous year's AADF on this link |
37 |
93 |
10492 |
89 |
2043 |
469 |
13186 |
| 2017 |
Estimated using previous year's AADF on this link |
30 |
95 |
10542 |
94 |
1949 |
460 |
13140 |
| 2016 |
Estimated using previous year's AADF on this link |
30 |
98 |
10554 |
97 |
1842 |
448 |
13039 |
| 2015 |
Dependent on a neighbouring counted link |
30 |
98 |
10425 |
98 |
1706 |
431 |
12758 |
| 2014 |
Estimated using previous year's AADF on this link |
12 |
193 |
12400 |
127 |
2520 |
723 |
15963 |
| 2013 |
Estimated using previous year's AADF on this link |
15 |
187 |
12121 |
113 |
2348 |
733 |
15502 |
| 2012 |
Estimated using previous year's AADF on this link |
15 |
177 |
12267 |
110 |
2212 |
711 |
15476 |
| 2011 |
Estimated using previous year's AADF on this link |
16 |
182 |
12356 |
108 |
2124 |
705 |
15475 |
| 2010 |
Dependent on a neighbouring counted link |
19 |
184 |
12431 |
106 |
2076 |
710 |
15507 |
| 2009 |
Estimated using previous year's AADF on this link |
71 |
245 |
12185 |
238 |
2218 |
618 |
15504 |
| 2008 |
Estimated using previous year's AADF on this link |
71 |
220 |
11923 |
241 |
2185 |
670 |
15239 |
| 2007 |
Estimated using previous year's AADF on this link |
63 |
230 |
12190 |
276 |
2141 |
678 |
15515 |
| 2006 |
Manual count |
102 |
241 |
12389 |
304 |
2033 |
734 |
15701 |
| 2005 |
Estimated using previous year's AADF on this link |
22 |
66 |
12515 |
197 |
2609 |
660 |
16047 |
| 2004 |
Estimated using previous year's AADF on this link |
27 |
80 |
13119 |
208 |
2448 |
646 |
16501 |
| 2003 |
Estimated using previous year's AADF on this link |
33 |
123 |
12951 |
254 |
2223 |
553 |
16104 |
| 2002 |
Manual count |
37 |
86 |
13448 |
261 |
2047 |
565 |
16407 |
| 2001 |
Estimated using previous year's AADF on this link |
35 |
83 |
13236 |
259 |
1910 |
594 |
16082 |
| 2000 |
Estimated using previous year's AADF on this link |
37 |
79 |
13659 |
247 |
1896 |
640 |
16521 |
Between Vincent Rd, Sittingbourne and Faversham Rd - 7.20km (4.47 miles)- id 56095 [118 London Road, Counting point]
| Year |
Count method |
Pedal cycles |
Two wheeled motor vehicles |
Cars and taxis |
Buses and coaches |
Light goods vehicles |
Heavy goods vehicles |
All motor vehicles |
| 2019 |
Manual count |
19 |
106 |
11045 |
84 |
2275 |
492 |
14001 |
| 2018 |
Estimated using previous year's AADF on this link |
30 |
93 |
10491 |
90 |
2041 |
469 |
13184 |
| 2017 |
Estimated using previous year's AADF on this link |
30 |
95 |
10542 |
94 |
1949 |
460 |
13140 |
| 2016 |
Estimated using previous year's AADF on this link |
30 |
98 |
10554 |
97 |
1842 |
448 |
13039 |
| 2015 |
Manual count |
30 |
98 |
10425 |
98 |
1706 |
431 |
12758 |
| 2014 |
Estimated using previous year's AADF on this link |
12 |
193 |
12400 |
127 |
2520 |
723 |
15963 |
| 2013 |
Estimated using previous year's AADF on this link |
15 |
187 |
12121 |
113 |
2348 |
733 |
15502 |
| 2012 |
Estimated using previous year's AADF on this link |
15 |
177 |
12267 |
110 |
2212 |
711 |
15476 |
| 2011 |
Estimated using previous year's AADF on this link |
16 |
182 |
12356 |
108 |
2124 |
705 |
15475 |
| 2010 |
Manual count |
19 |
184 |
12431 |
106 |
2076 |
710 |
15507 |
| 2009 |
Estimated using previous year's AADF on this link |
39 |
128 |
10775 |
86 |
2116 |
533 |
13638 |
| 2008 |
Manual count |
34 |
123 |
10906 |
86 |
2077 |
588 |
13780 |
| 2007 |
Manual count |
27 |
132 |
11037 |
160 |
2203 |
602 |
14134 |
| 2006 |
Manual count |
34 |
107 |
10218 |
141 |
1791 |
677 |
12934 |
| 2005 |
Manual count |
22 |
186 |
10833 |
147 |
1737 |
557 |
13460 |
| 2004 |
Manual count |
22 |
175 |
11621 |
184 |
1842 |
539 |
14361 |
| 2003 |
Manual count |
25 |
219 |
10861 |
149 |
1717 |
624 |
13570 |
| 2002 |
Manual count |
28 |
230 |
11399 |
150 |
1777 |
674 |
14230 |
| 2001 |
Manual count |
24 |
122 |
10263 |
121 |
1859 |
654 |
13019 |
| 2000 |
Manual count |
118 |
186 |
11376 |
191 |
1884 |
603 |
14240 |
Between Faversham Rd and B2045 Western Link - 0.70km (0.43 miles)- id 78176
| Year |
Count method |
Pedal cycles |
Two wheeled motor vehicles |
Cars and taxis |
Buses and coaches |
Light goods vehicles |
Heavy goods vehicles |
All motor vehicles |
| 2019 |
Dependent on a neighbouring counted link |
19 |
106 |
11045 |
84 |
2275 |
492 |
14001 |
| 2018 |
Estimated using previous year's AADF on this link |
37 |
93 |
10492 |
89 |
2043 |
469 |
13186 |
| 2017 |
Estimated using previous year's AADF on this link |
30 |
95 |
10542 |
94 |
1949 |
460 |
13140 |
| 2016 |
Estimated using previous year's AADF on this link |
30 |
98 |
10554 |
97 |
1842 |
448 |
13039 |
| 2015 |
Dependent on a neighbouring counted link |
30 |
98 |
10425 |
98 |
1706 |
431 |
12758 |
| 2014 |
Estimated using previous year's AADF on this link |
12 |
193 |
12400 |
127 |
2520 |
723 |
15963 |
| 2013 |
Estimated using previous year's AADF on this link |
15 |
187 |
12121 |
113 |
2348 |
733 |
15502 |
| 2012 |
Estimated using previous year's AADF on this link |
15 |
177 |
12267 |
110 |
2212 |
711 |
15476 |
| 2011 |
Estimated using previous year's AADF on this link |
16 |
182 |
12356 |
108 |
2124 |
705 |
15475 |
| 2010 |
Dependent on a neighbouring counted link |
19 |
184 |
12431 |
106 |
2076 |
710 |
15507 |
| 2009 |
Estimated from nearby links |
41 |
136 |
11422 |
92 |
2243 |
563 |
14456 |
| 2008 |
Estimated from nearby links |
36 |
130 |
11560 |
92 |
2202 |
622 |
14606 |
| 2007 |
Estimated from nearby links |
29 |
140 |
11699 |
169 |
2336 |
638 |
14982 |
| 2006 |
Estimated from nearby links |
36 |
114 |
10830 |
150 |
1899 |
719 |
13712 |
| 2005 |
Estimated from nearby links |
23 |
197 |
11483 |
157 |
1841 |
593 |
14271 |
| 2004 |
Estimated from nearby links |
23 |
186 |
12318 |
195 |
1952 |
573 |
15224 |
| 2003 |
Estimated from nearby links |
26 |
232 |
11512 |
157 |
1820 |
663 |
14384 |
| 2002 |
Estimated from nearby links |
30 |
244 |
12083 |
159 |
1884 |
714 |
15084 |
| 2001 |
Estimated from nearby links |
26 |
130 |
10879 |
128 |
1970 |
695 |
13802 |
| 2000 |
Estimated from nearby links |
125 |
197 |
12059 |
202 |
1997 |
638 |
15093 |
Between B2045 Western Link and B2040 Ospringe Rd - 0.70km (0.43 miles) - id 56100
| Year |
Count method |
Pedal cycles |
Two wheeled motor vehicles |
Cars and taxis |
Buses and coaches |
Light goods vehicles |
Heavy goods vehicles |
All motor vehicles |
| 2019 |
Dependent on a neighbouring counted link |
36 |
110 |
12320 |
65 |
2773 |
1024 |
16292 |
| 2018 |
Estimated using previous year's AADF on this link |
44 |
112 |
13503 |
63 |
3480 |
999 |
18158 |
| 2017 |
Estimated using previous year's AADF on this link |
39 |
113 |
13654 |
69 |
3416 |
998 |
18250 |
| 2016 |
Estimated using previous year's AADF on this link |
41 |
112 |
13755 |
74 |
3245 |
985 |
18171 |
| 2015 |
Estimated using previous year's AADF on this link |
44 |
114 |
13544 |
80 |
2971 |
952 |
17662 |
| 2014 |
Estimated using previous year's AADF on this link |
47 |
129 |
13281 |
74 |
2833 |
978 |
17295 |
| 2013 |
Estimated using previous year's AADF on this link |
49 |
135 |
12930 |
77 |
2649 |
970 |
16762 |
| 2012 |
Estimated using previous year's AADF on this link |
49 |
121 |
13045 |
74 |
2549 |
958 |
16748 |
| 2011 |
Dependent on a neighbouring counted link |
52 |
127 |
13252 |
68 |
2519 |
982 |
16948 |
| 2010 |
Estimated using previous year's AADF on this link |
25 |
120 |
10105 |
96 |
3499 |
766 |
14586 |
| 2009 |
Manual count |
21 |
163 |
12363 |
75 |
1894 |
898 |
15393 |
| 2008 |
Estimated using previous year's AADF on this link |
13 |
69 |
9903 |
68 |
3108 |
998 |
14146 |
| 2007 |
Estimated using previous year's AADF on this link |
12 |
72 |
10126 |
78 |
3045 |
998 |
14319 |
| 2006 |
Estimated using previous year's AADF on this link |
20 |
76 |
10290 |
86 |
2892 |
1066 |
14410 |
| 2005 |
Estimated using previous year's AADF on this link |
13 |
87 |
10489 |
93 |
2849 |
1132 |
14650 |
| 2004 |
Estimated using previous year's AADF on this link |
15 |
105 |
10995 |
98 |
2672 |
1119 |
14989 |
| 2003 |
Estimated using previous year's AADF on this link |
18 |
161 |
10854 |
120 |
2428 |
959 |
14522 |
| 2002 |
Estimated using previous year's AADF on this link |
20 |
113 |
11271 |
123 |
2235 |
959 |
14701 |
| 2001 |
Manual count |
20 |
109 |
11094 |
122 |
2085 |
990 |
14400 |
| 2000 |
Estimated using previous year's AADF on this link |
20 |
137 |
11010 |
123 |
1794 |
1069 |
14133 |
Between B2040 and B2041 - 1.00km (0.62 miles) - id 28687
| Year |
Count method |
Pedal cycles |
Two wheeled motor vehicles |
Cars and taxis |
Buses and coaches |
Light goods vehicles |
Heavy goods vehicles |
All motor vehicles |
| 2019 |
Manual count |
36 |
110 |
12320 |
65 |
2773 |
1024 |
16292 |
| 2018 |
Estimated using previous year's AADF on this link |
43 |
112 |
13503 |
63 |
3480 |
999 |
18158 |
| 2017 |
Estimated using previous year's AADF on this link |
39 |
113 |
13654 |
69 |
3416 |
998 |
18250 |
| 2016 |
Estimated using previous year's AADF on this link |
41 |
112 |
13755 |
74 |
3245 |
985 |
18171 |
| 2015 |
Estimated using previous year's AADF on this link |
44 |
114 |
13544 |
80 |
2971 |
952 |
17662 |
| 2014 |
Estimated using previous year's AADF on this link |
47 |
129 |
13281 |
74 |
2833 |
978 |
17295 |
| 2013 |
Estimated using previous year's AADF on this link |
49 |
135 |
12930 |
77 |
2649 |
970 |
16762 |
| 2012 |
Estimated using previous year's AADF on this link |
49 |
121 |
13045 |
74 |
2549 |
958 |
16748 |
| 2011 |
Manual count |
52 |
127 |
13252 |
68 |
2519 |
982 |
16948 |
| 2010 |
Estimated using previous year's AADF on this link |
25 |
120 |
10105 |
96 |
3499 |
766 |
14586 |
| 2009 |
Estimated using previous year's AADF on this link |
25 |
126 |
10166 |
85 |
3276 |
746 |
14399 |
| 2008 |
Estimated using previous year's AADF on this link |
25 |
113 |
9947 |
86 |
3228 |
802 |
14176 |
| 2007 |
Estimated using previous year's AADF on this link |
22 |
118 |
10170 |
99 |
3162 |
817 |
14366 |
| 2006 |
Estimated using previous year's AADF on this link |
35 |
124 |
10336 |
109 |
3002 |
888 |
14459 |
| 2005 |
Estimated using previous year's AADF on this link |
23 |
143 |
10536 |
118 |
2958 |
963 |
14718 |
| 2004 |
Estimated using previous year's AADF on this link |
27 |
173 |
11044 |
125 |
2775 |
979 |
15096 |
| 2003 |
Estimated using previous year's AADF on this link |
33 |
263 |
10903 |
152 |
2521 |
863 |
14702 |
| 2002 |
Manual count |
37 |
185 |
11321 |
156 |
2321 |
879 |
14862 |
| 2001 |
Estimated using previous year's AADF on this link |
29 |
128 |
10644 |
231 |
1668 |
773 |
13444 |
| 2000 |
Estimated using previous year's AADF on this link |
31 |
122 |
10985 |
221 |
1657 |
828 |
13813 |
Between B2041 and A251 (Ashford Road) 0.10km (0.06 miles) - id 8557
| Year |
Count method |
Pedal cycles |
Two wheeled motor vehicles |
Cars and taxis |
Buses and coaches |
Light goods vehicles |
Heavy goods vehicles |
All motor vehicles |
| 2019 |
Estimated using previous year's AADF on this link |
114 |
200 |
21078 |
68 |
3965 |
1151 |
26463 |
| 2018 |
Manual count |
94 |
186 |
21032 |
69 |
3978 |
1145 |
26411 |
| 2017 |
Estimated using previous year's AADF on this link |
49 |
160 |
19896 |
84 |
4014 |
903 |
25056 |
| 2016 |
Estimated using previous year's AADF on this link |
49 |
165 |
19920 |
87 |
3792 |
881 |
24845 |
| 2015 |
Estimated using previous year's AADF on this link |
53 |
169 |
19614 |
94 |
3472 |
879 |
24226 |
| 2014 |
Manual count |
57 |
166 |
19980 |
94 |
3301 |
871 |
24412 |
| 2013 |
Estimated using previous year's AADF on this link |
33 |
186 |
16614 |
93 |
2350 |
732 |
19975 |
| 2012 |
Estimated using previous year's AADF on this link |
33 |
186 |
16709 |
99 |
2323 |
731 |
20048 |
| 2011 |
Estimated using previous year's AADF on this link |
35 |
206 |
16780 |
92 |
2419 |
799 |
20296 |
| 2010 |
Manual count |
32 |
194 |
16865 |
92 |
2346 |
795 |
20292 |
| 2009 |
Estimated using previous year's AADF on this link |
14 |
116 |
16482 |
170 |
3771 |
1117 |
21656 |
| 2008 |
Estimated using previous year's AADF on this link |
14 |
123 |
16751 |
174 |
3482 |
1150 |
21680 |
| 2007 |
Estimated using previous year's AADF on this link |
13 |
132 |
17075 |
173 |
3326 |
1189 |
21895 |
| 2006 |
Estimated using previous year's AADF on this link |
21 |
131 |
17918 |
179 |
3048 |
1199 |
22475 |
| 2005 |
Estimated using previous year's AADF on this link |
14 |
125 |
17864 |
183 |
3001 |
1190 |
22363 |
| 2004 |
Manual count |
16 |
125 |
18322 |
185 |
2925 |
1245 |
22802 |
| 2003 |
Estimated using previous year's AADF on this link |
35 |
300 |
18268 |
159 |
2868 |
947 |
22542 |
| 2002 |
Estimated using previous year's AADF on this link |
40 |
267 |
18527 |
178 |
2631 |
902 |
22505 |
| 2001 |
Estimated using previous year's AADF on this link |
38 |
265 |
18565 |
174 |
2625 |
923 |
22552 |
| 2000 |
Estimated using previous year's AADF on this link |
40 |
255 |
18201 |
170 |
2635 |
943 |
22204 |
Between A251 and B2040 Love Lane - 1.10km (0.68 miles) - id 78206
| Year |
Count method |
Pedal cycles |
Two wheeled motor vehicles |
Cars and taxis |
Buses and coaches |
Light goods vehicles |
Heavy goods vehicles |
All motor vehicles |
| 2019 |
Estimated using previous year's AADF on this link |
44 |
139 |
14697 |
39 |
2283 |
504 |
17661 |
| 2018 |
Manual count |
40 |
148 |
14515 |
38 |
2303 |
503 |
17507 |
| 2017 |
Estimated using previous year's AADF on this link |
44 |
79 |
14230 |
53 |
3945 |
847 |
19154 |
| 2016 |
Estimated using previous year's AADF on this link |
46 |
78 |
14335 |
57 |
3747 |
839 |
19057 |
| 2015 |
Estimated using previous year's AADF on this link |
50 |
80 |
14115 |
61 |
3431 |
813 |
18500 |
| 2014 |
Estimated using previous year's AADF on this link |
53 |
91 |
13841 |
57 |
3272 |
847 |
18107 |
| 2013 |
Estimated using previous year's AADF on this link |
55 |
95 |
13476 |
59 |
3059 |
830 |
17518 |
| 2012 |
Estimated using previous year's AADF on this link |
56 |
85 |
13596 |
57 |
2943 |
802 |
17482 |
| 2011 |
Estimated using previous year's AADF on this link |
59 |
89 |
13811 |
52 |
2909 |
789 |
17650 |
| 2010 |
Manual count |
54 |
105 |
13852 |
55 |
2606 |
752 |
17370 |
| 2009 |
Estimated using previous year's AADF on this link |
17 |
55 |
12089 |
66 |
2833 |
546 |
15589 |
| 2008 |
Estimated using previous year's AADF on this link |
17 |
49 |
11829 |
66 |
2791 |
586 |
15321 |
| 2007 |
Estimated using previous year's AADF on this link |
16 |
52 |
12095 |
76 |
2735 |
584 |
15542 |
| 2006 |
Estimated using previous year's AADF on this link |
25 |
54 |
12292 |
83 |
2596 |
623 |
15648 |
| 2005 |
Estimated using previous year's AADF on this link |
16 |
61 |
12531 |
90 |
2558 |
658 |
15898 |
| 2004 |
Estimated using previous year's AADF on this link |
19 |
75 |
13134 |
95 |
2399 |
638 |
16341 |
| 2003 |
Estimated using previous year's AADF on this link |
23 |
114 |
12965 |
116 |
2180 |
539 |
15914 |
| 2002 |
Manual count |
26 |
80 |
13464 |
119 |
2007 |
544 |
16214 |
| 2001 |
Estimated using previous year's AADF on this link |
25 |
77 |
13252 |
118 |
1872 |
565 |
15884 |
| 2000 |
Estimated using previous year's AADF on this link |
26 |
73 |
13676 |
113 |
1859 |
603 |
16324 |
Between B2040 Love Lane and M2 - 1.50km (0.93 miles) - id 18400
| Year |
Count method |
Pedal cycles |
Two wheeled motor vehicles |
Cars and taxis |
Buses and coaches |
Light goods vehicles |
Heavy goods vehicles |
All motor vehicles |
| 2019 |
Estimated using previous year's AADF on this link |
13 |
175 |
12643 |
110 |
2283 |
455 |
15666 |
| 2018 |
Estimated using previous year's AADF on this link |
11 |
162 |
12615 |
111 |
2291 |
453 |
15632 |
| 2017 |
Manual count |
11 |
166 |
12676 |
117 |
2187 |
445 |
15592 |
| 2016 |
Estimated using previous year's AADF on this link |
13 |
189 |
14869 |
129 |
2799 |
548 |
18534 |
| 2015 |
Estimated using previous year's AADF on this link |
13 |
189 |
14687 |
130 |
2592 |
531 |
18130 |
| 2014 |
Estimated using previous year's AADF on this link |
13 |
183 |
14257 |
133 |
2332 |
492 |
17396 |
| 2013 |
Manual count |
16 |
177 |
13936 |
118 |
2172 |
503 |
16906 |
| 2012 |
Estimated using previous year's AADF on this link |
9 |
162 |
12882 |
150 |
2144 |
559 |
15897 |
| 2011 |
Estimated using previous year's AADF on this link |
10 |
167 |
12975 |
148 |
2059 |
562 |
15911 |
| 2010 |
Estimated using previous year's AADF on this link |
12 |
169 |
13053 |
146 |
2012 |
576 |
15956 |
| 2009 |
Manual count |
12 |
191 |
13374 |
137 |
1961 |
567 |
16230 |
| 2008 |
Estimated using previous year's AADF on this link |
13 |
102 |
14403 |
187 |
2363 |
590 |
17645 |
| 2007 |
Manual count |
13 |
104 |
14505 |
185 |
2359 |
595 |
17748 |
| 2006 |
Estimated using previous year's AADF on this link |
1 |
119 |
13607 |
119 |
2470 |
652 |
16967 |
| 2005 |
Estimated using previous year's AADF on this link |
1 |
141 |
13236 |
127 |
2354 |
641 |
16499 |
| 2004 |
Estimated using previous year's AADF on this link |
1 |
153 |
13249 |
126 |
2242 |
663 |
16433 |
| 2003 |
Estimated using previous year's AADF on this link |
1 |
148 |
13236 |
147 |
2225 |
647 |
16403 |
| 2002 |
Manual count |
1 |
121 |
13118 |
141 |
1974 |
657 |
16011 |
| 2001 |
Estimated using previous year's AADF on this link |
8 |
140 |
10417 |
122 |
1482 |
616 |
12777 |
| 2000 |
Estimated using previous year's AADF on this link |
9 |
126 |
10386 |
124 |
1433 |
612 |
12681 |